SOL-USD Trading Predictions
1 Day Prediction
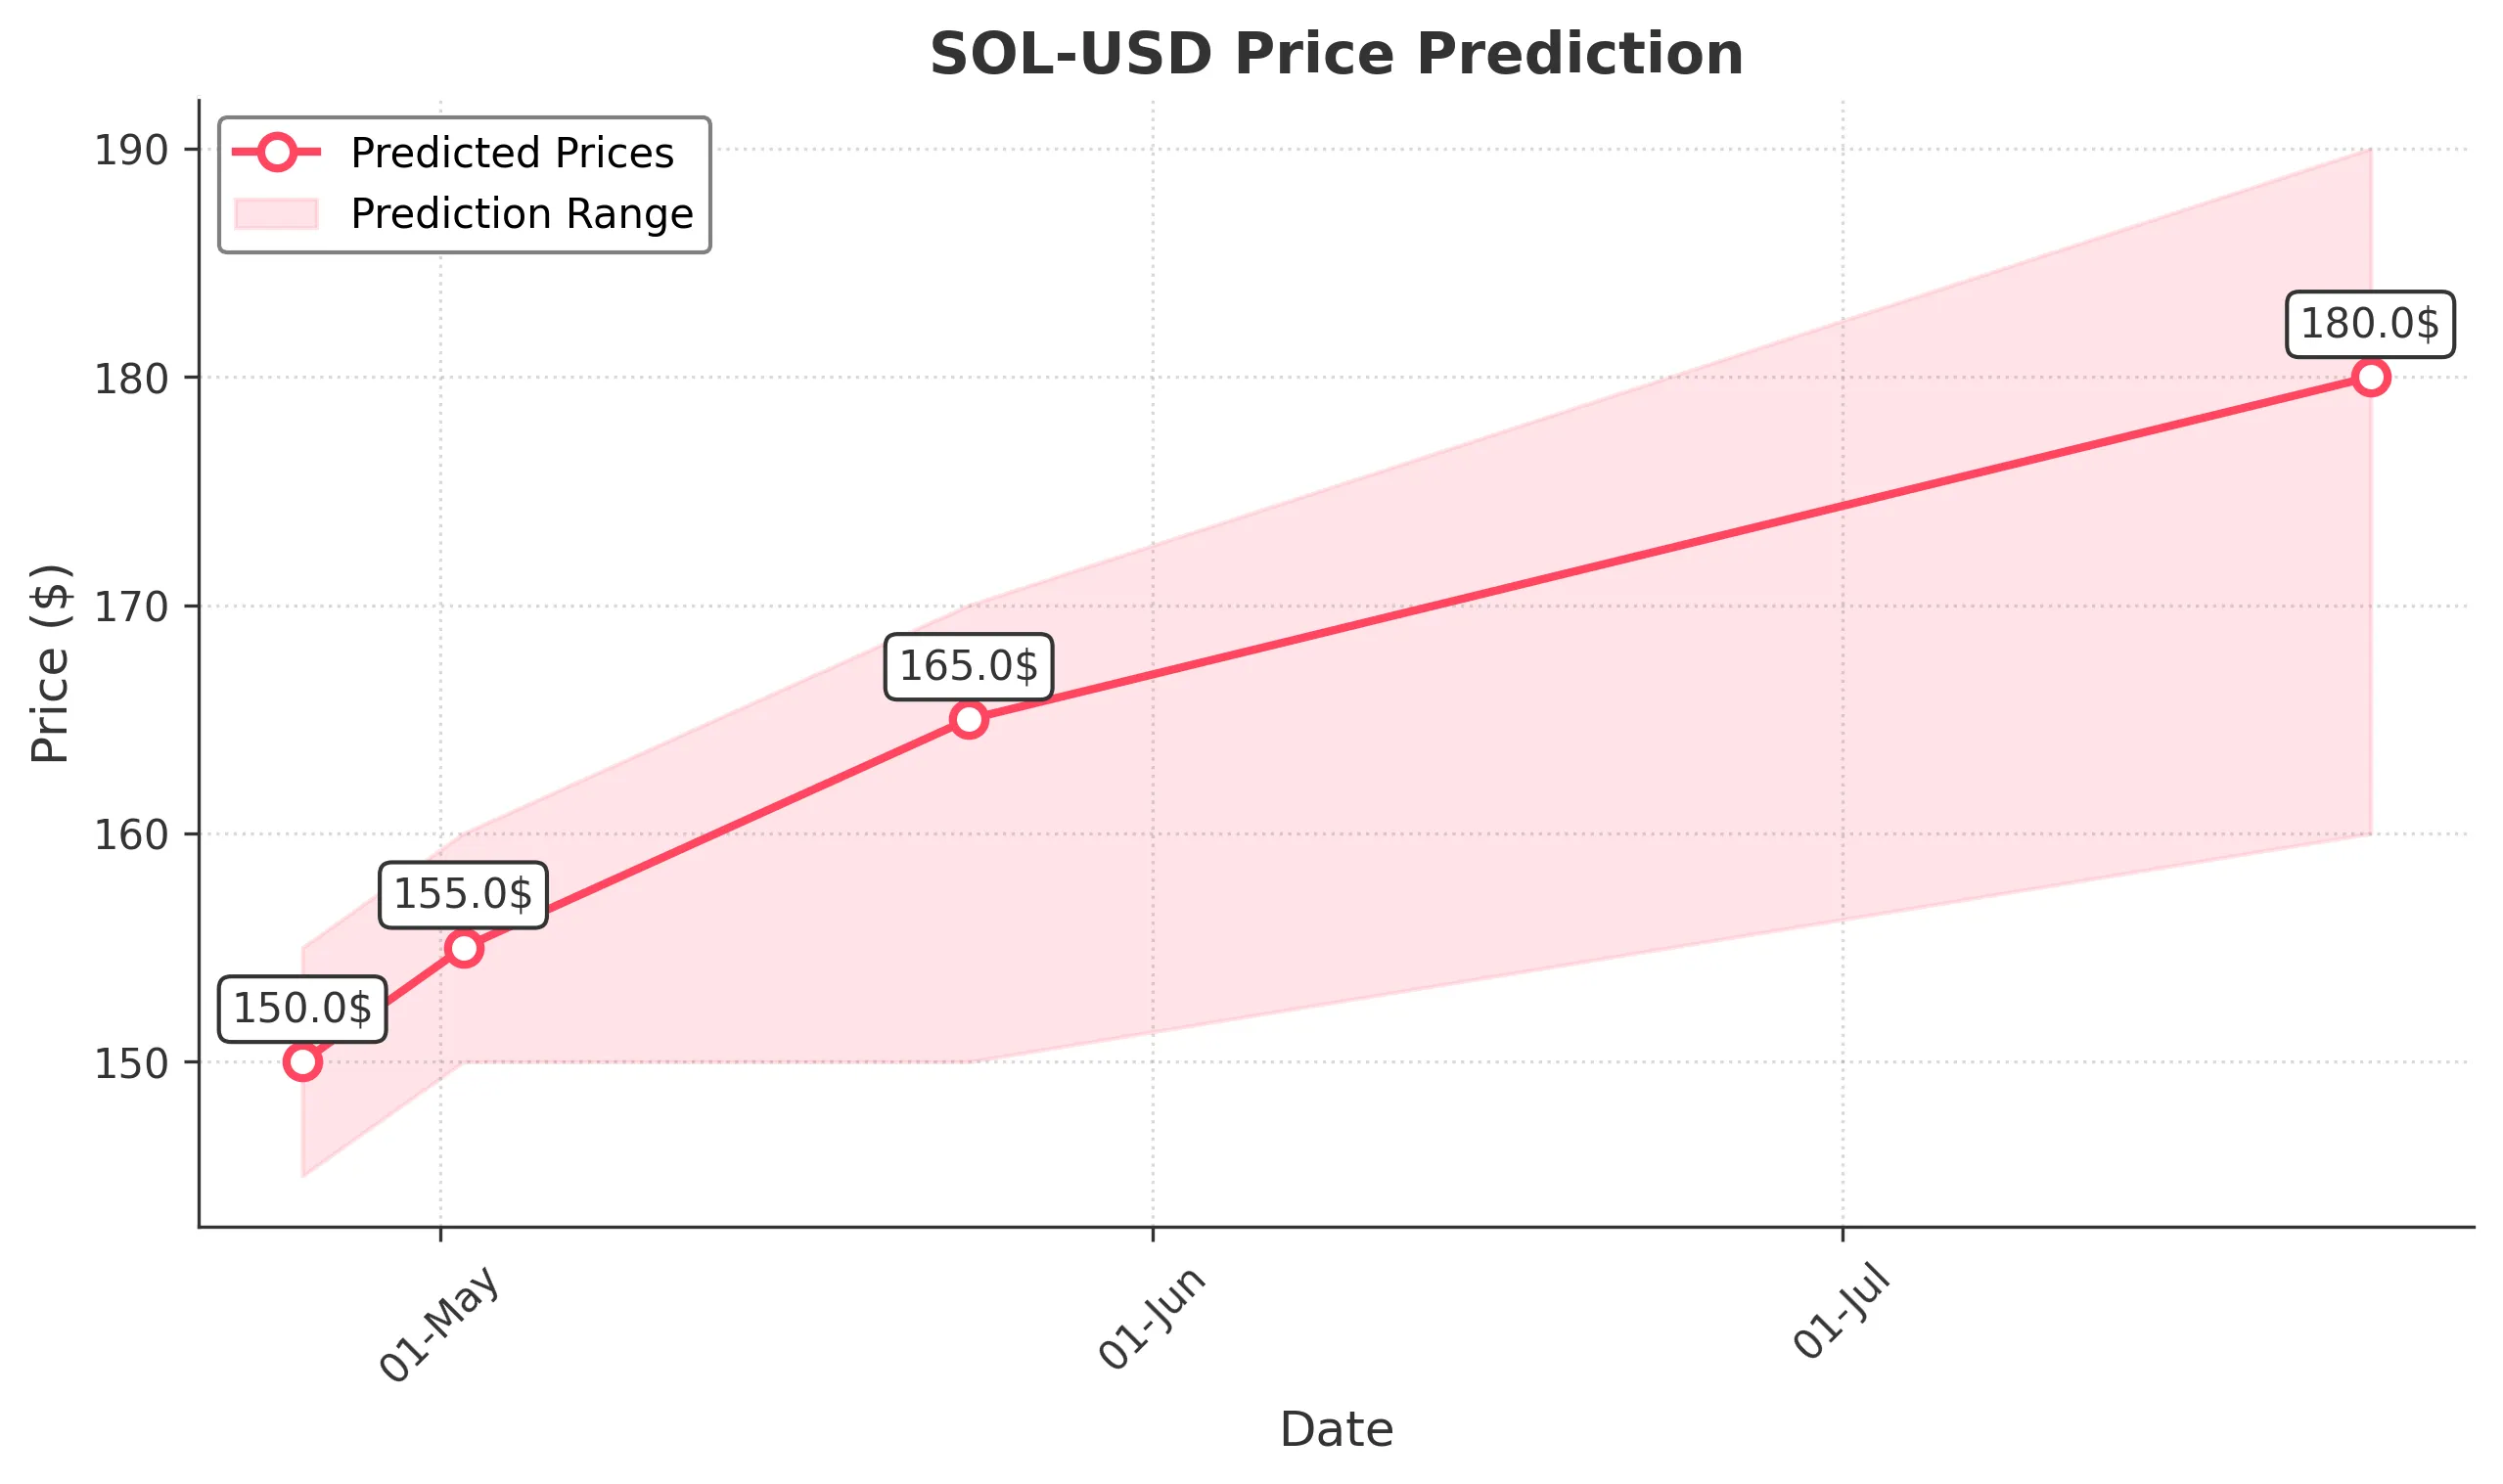
Target: April 25, 2025$150
$149
$155
$145
Description
The stock shows a potential rebound after recent declines, supported by a bullish engulfing pattern. RSI indicates oversold conditions, suggesting a possible upward correction. However, volatility remains high, and market sentiment is mixed.
Analysis
Over the past 3 months, SOL-USD has experienced significant volatility, with a bearish trend recently. Key support at 130.0 and resistance at 155.0. Technical indicators show mixed signals, with RSI indicating oversold conditions, while MACD suggests bearish momentum. Volume spikes indicate heightened trading activity.
Confidence Level
Potential Risks
Market volatility and external news could impact the prediction. A sudden downturn is possible if bearish sentiment prevails.
1 Week Prediction
Target: May 2, 2025$155
$152
$160
$150
Description
A potential upward trend is indicated by recent bullish patterns and a recovery in volume. The MACD shows signs of a bullish crossover, while the RSI is moving towards neutral territory. However, resistance at 160.0 may limit gains.
Analysis
The stock has shown a bearish trend recently, with significant fluctuations. Support at 130.0 and resistance at 160.0 are critical levels. Technical indicators suggest a potential reversal, but overall market sentiment is cautious, influenced by macroeconomic factors.
Confidence Level
Potential Risks
Resistance levels may hinder upward movement, and any negative news could reverse the trend. Market sentiment remains cautious.
1 Month Prediction
Target: May 24, 2025$165
$160
$170
$150
Description
If the bullish momentum continues, the stock could reach 165.0, supported by improving market sentiment and potential positive news. However, resistance at 170.0 may pose challenges. Watch for volume trends for confirmation.
Analysis
The stock has been volatile, with a recent bearish trend. Key support at 130.0 and resistance at 170.0. Technical indicators show potential for recovery, but market sentiment remains mixed, influenced by broader economic conditions.
Confidence Level
Potential Risks
Market conditions are unpredictable, and external factors could lead to sudden price changes. A bearish reversal is still a possibility.
3 Months Prediction
Target: July 24, 2025$180
$175
$190
$160
Description
If the current bullish trend persists, the stock could reach 180.0, driven by positive market sentiment and potential recovery in the crypto market. However, external factors could impact this trajectory.
Analysis
The stock has shown significant volatility, with a bearish trend recently. Key support at 130.0 and resistance at 190.0. Technical indicators suggest potential for recovery, but market sentiment remains cautious, influenced by macroeconomic factors.
Confidence Level
Potential Risks
Long-term predictions are uncertain due to market volatility and potential regulatory changes. A bearish trend could emerge if negative news surfaces.