SOL-USD Trading Predictions
1 Day Prediction
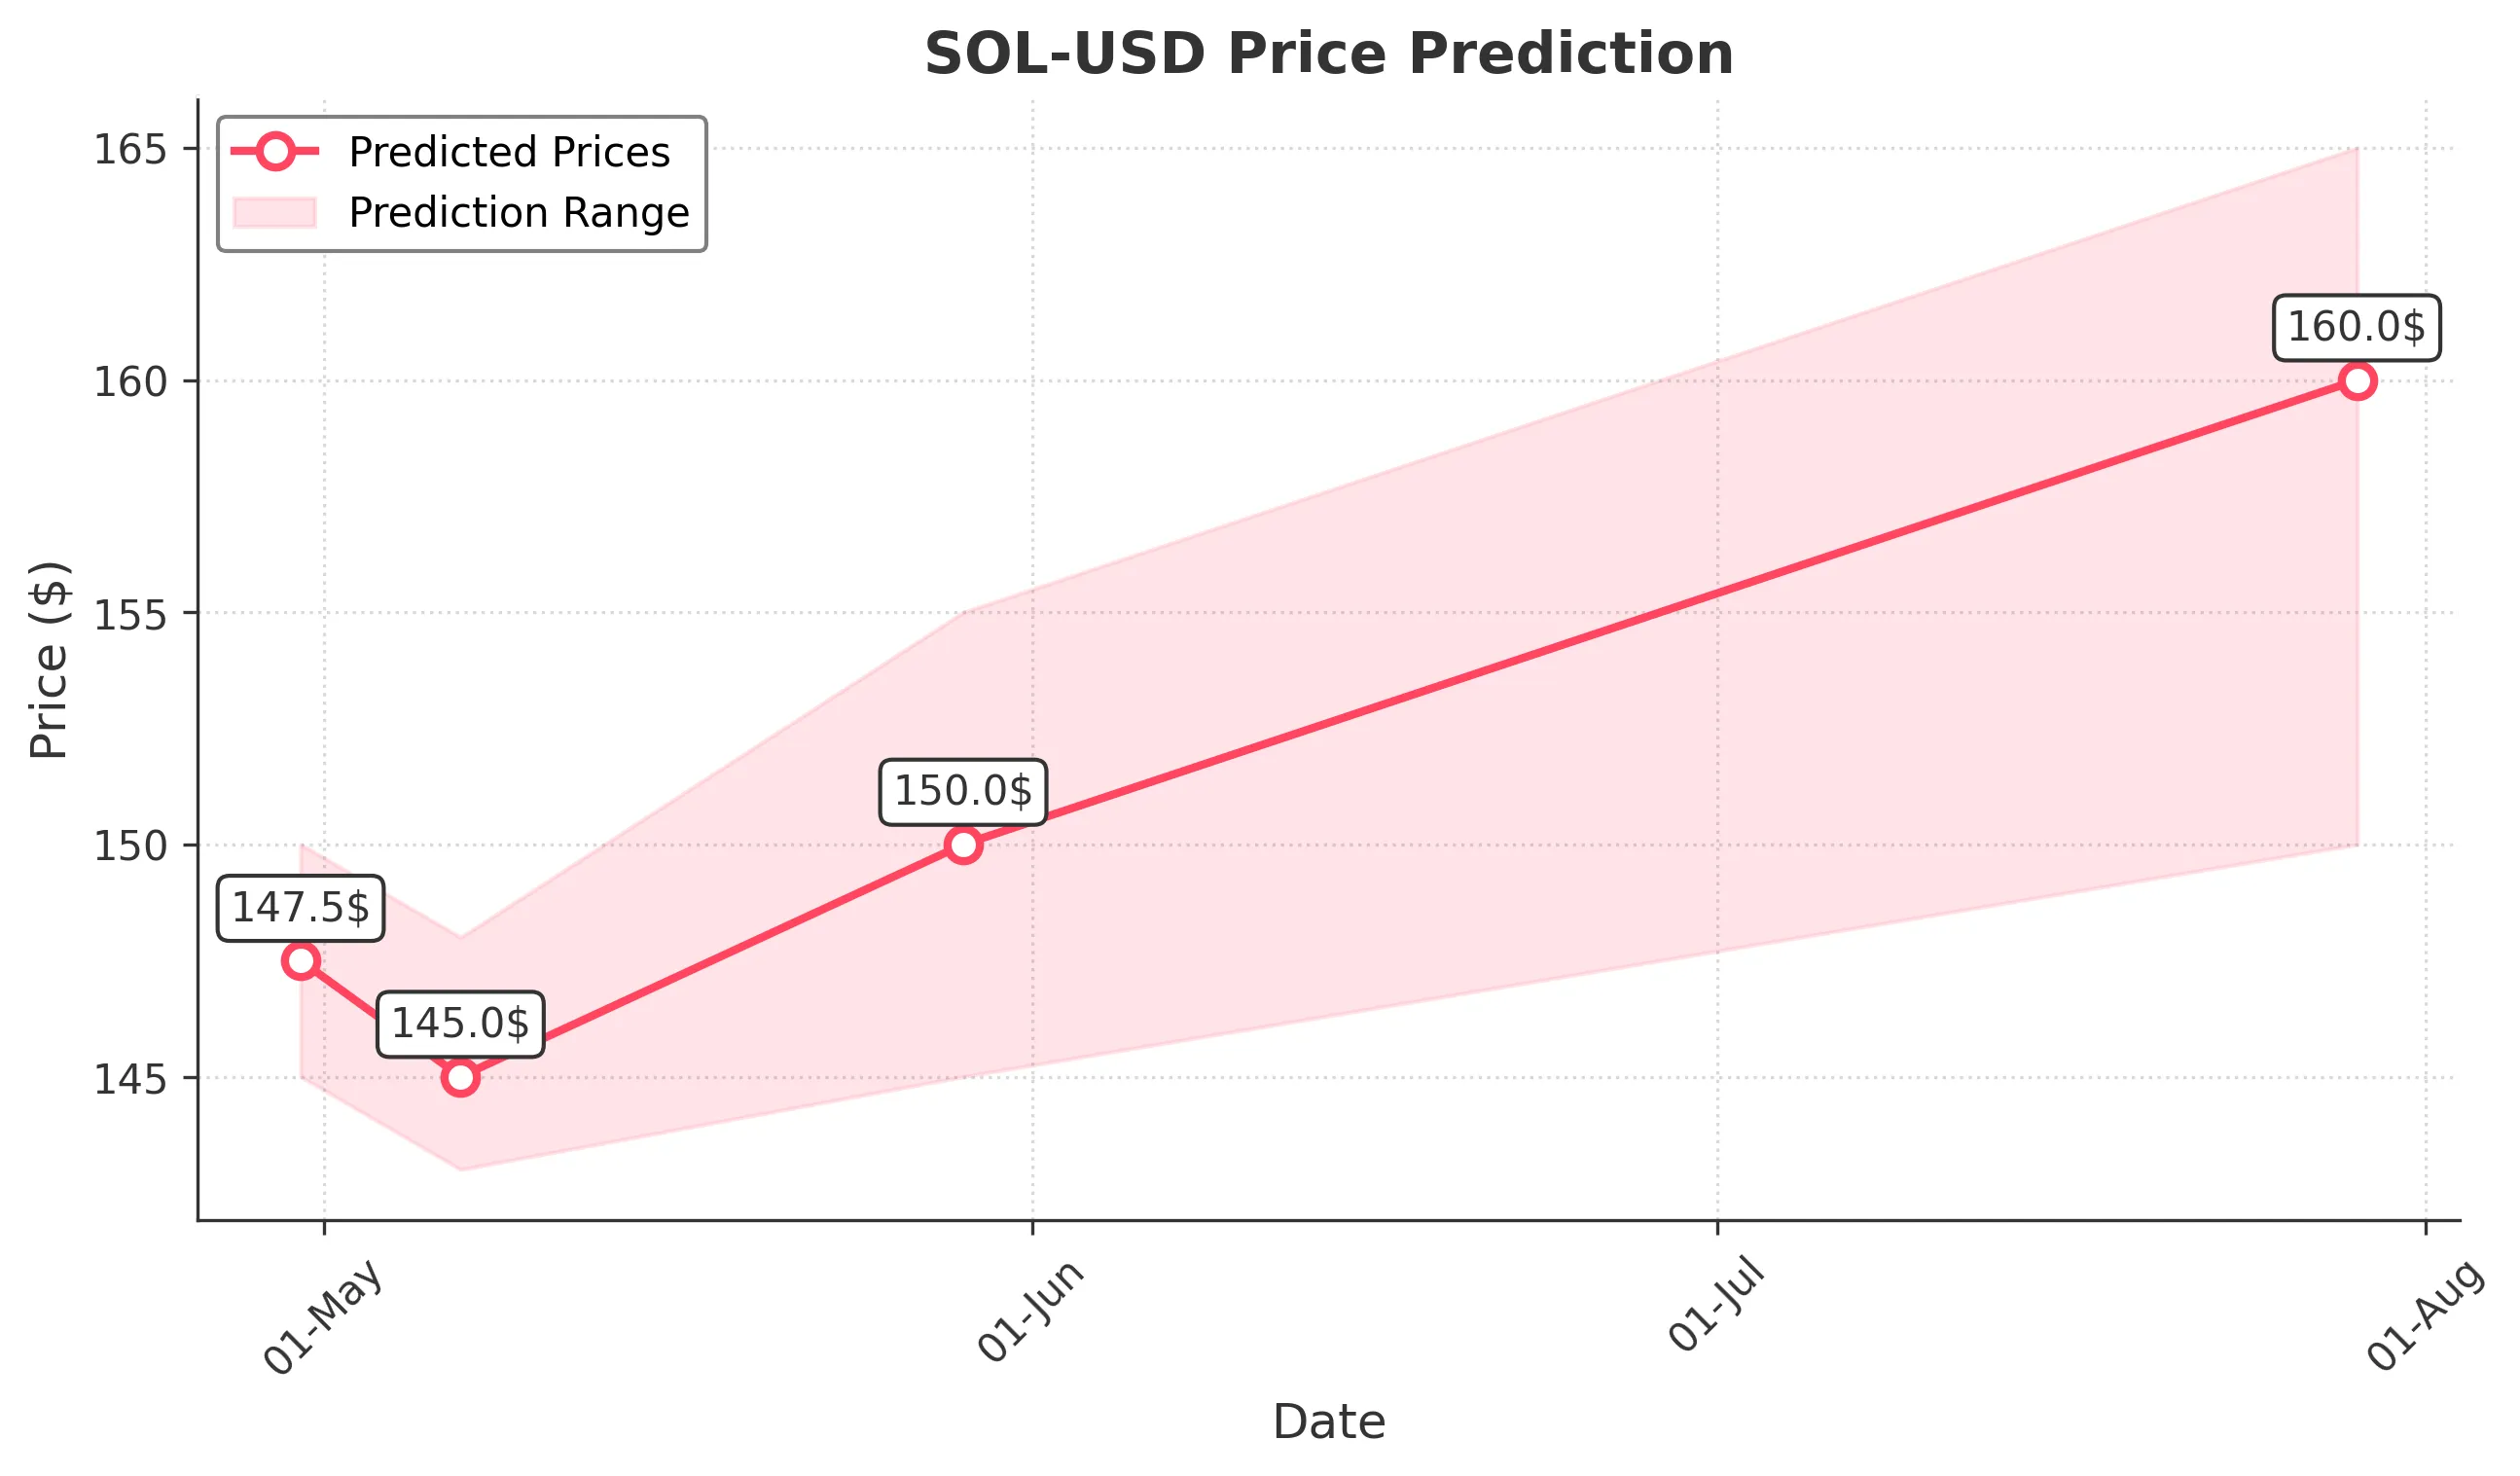
Target: April 30, 2025$147.5
$147
$150
$145
Description
The stock shows a slight bearish trend with recent lower highs and lower lows. RSI indicates oversold conditions, suggesting a potential bounce. However, volatility remains high, and market sentiment is cautious.
Analysis
Over the past 3 months, SOL-USD has experienced significant fluctuations, with a bearish trend recently. Key support is around $145, while resistance is near $150. Volume spikes indicate heightened trading activity, reflecting market uncertainty.
Confidence Level
Potential Risks
Market volatility and external news could impact the price significantly.
1 Week Prediction
Target: May 7, 2025$145
$146
$148
$143
Description
The stock may continue to face downward pressure, but a potential reversal could occur if it holds above $145. The MACD shows bearish momentum, but a bullish divergence in RSI could signal a reversal.
Analysis
The stock has been in a bearish phase, with significant resistance at $150. Recent trading volumes suggest a lack of conviction in the current trend. The market sentiment remains cautious, influenced by broader economic factors.
Confidence Level
Potential Risks
Unforeseen macroeconomic events or negative sentiment could lead to further declines.
1 Month Prediction
Target: May 29, 2025$150
$148
$155
$145
Description
A potential recovery is anticipated as the stock approaches key support levels. If bullish momentum builds, it could test resistance at $155. However, caution is warranted due to ongoing volatility.
Analysis
The stock has shown signs of consolidation around $145-$150. Technical indicators suggest a possible reversal, but the overall trend remains bearish. Volume patterns indicate indecision among traders, and external factors could influence future performance.
Confidence Level
Potential Risks
Market sentiment could shift rapidly, impacting the recovery potential.
3 Months Prediction
Target: July 29, 2025$160
$155
$165
$150
Description
If the stock can break above $155, a bullish trend may develop, targeting $160. The market may react positively to macroeconomic improvements, but caution is advised due to potential volatility.
Analysis
The stock's performance over the last three months has been volatile, with significant price swings. Key resistance levels are at $155, while support is around $145. The overall market sentiment remains mixed, influenced by broader economic conditions.
Confidence Level
Potential Risks
Long-term predictions are uncertain due to market volatility and external economic factors.