SOL-USD Trading Predictions
1 Day Prediction
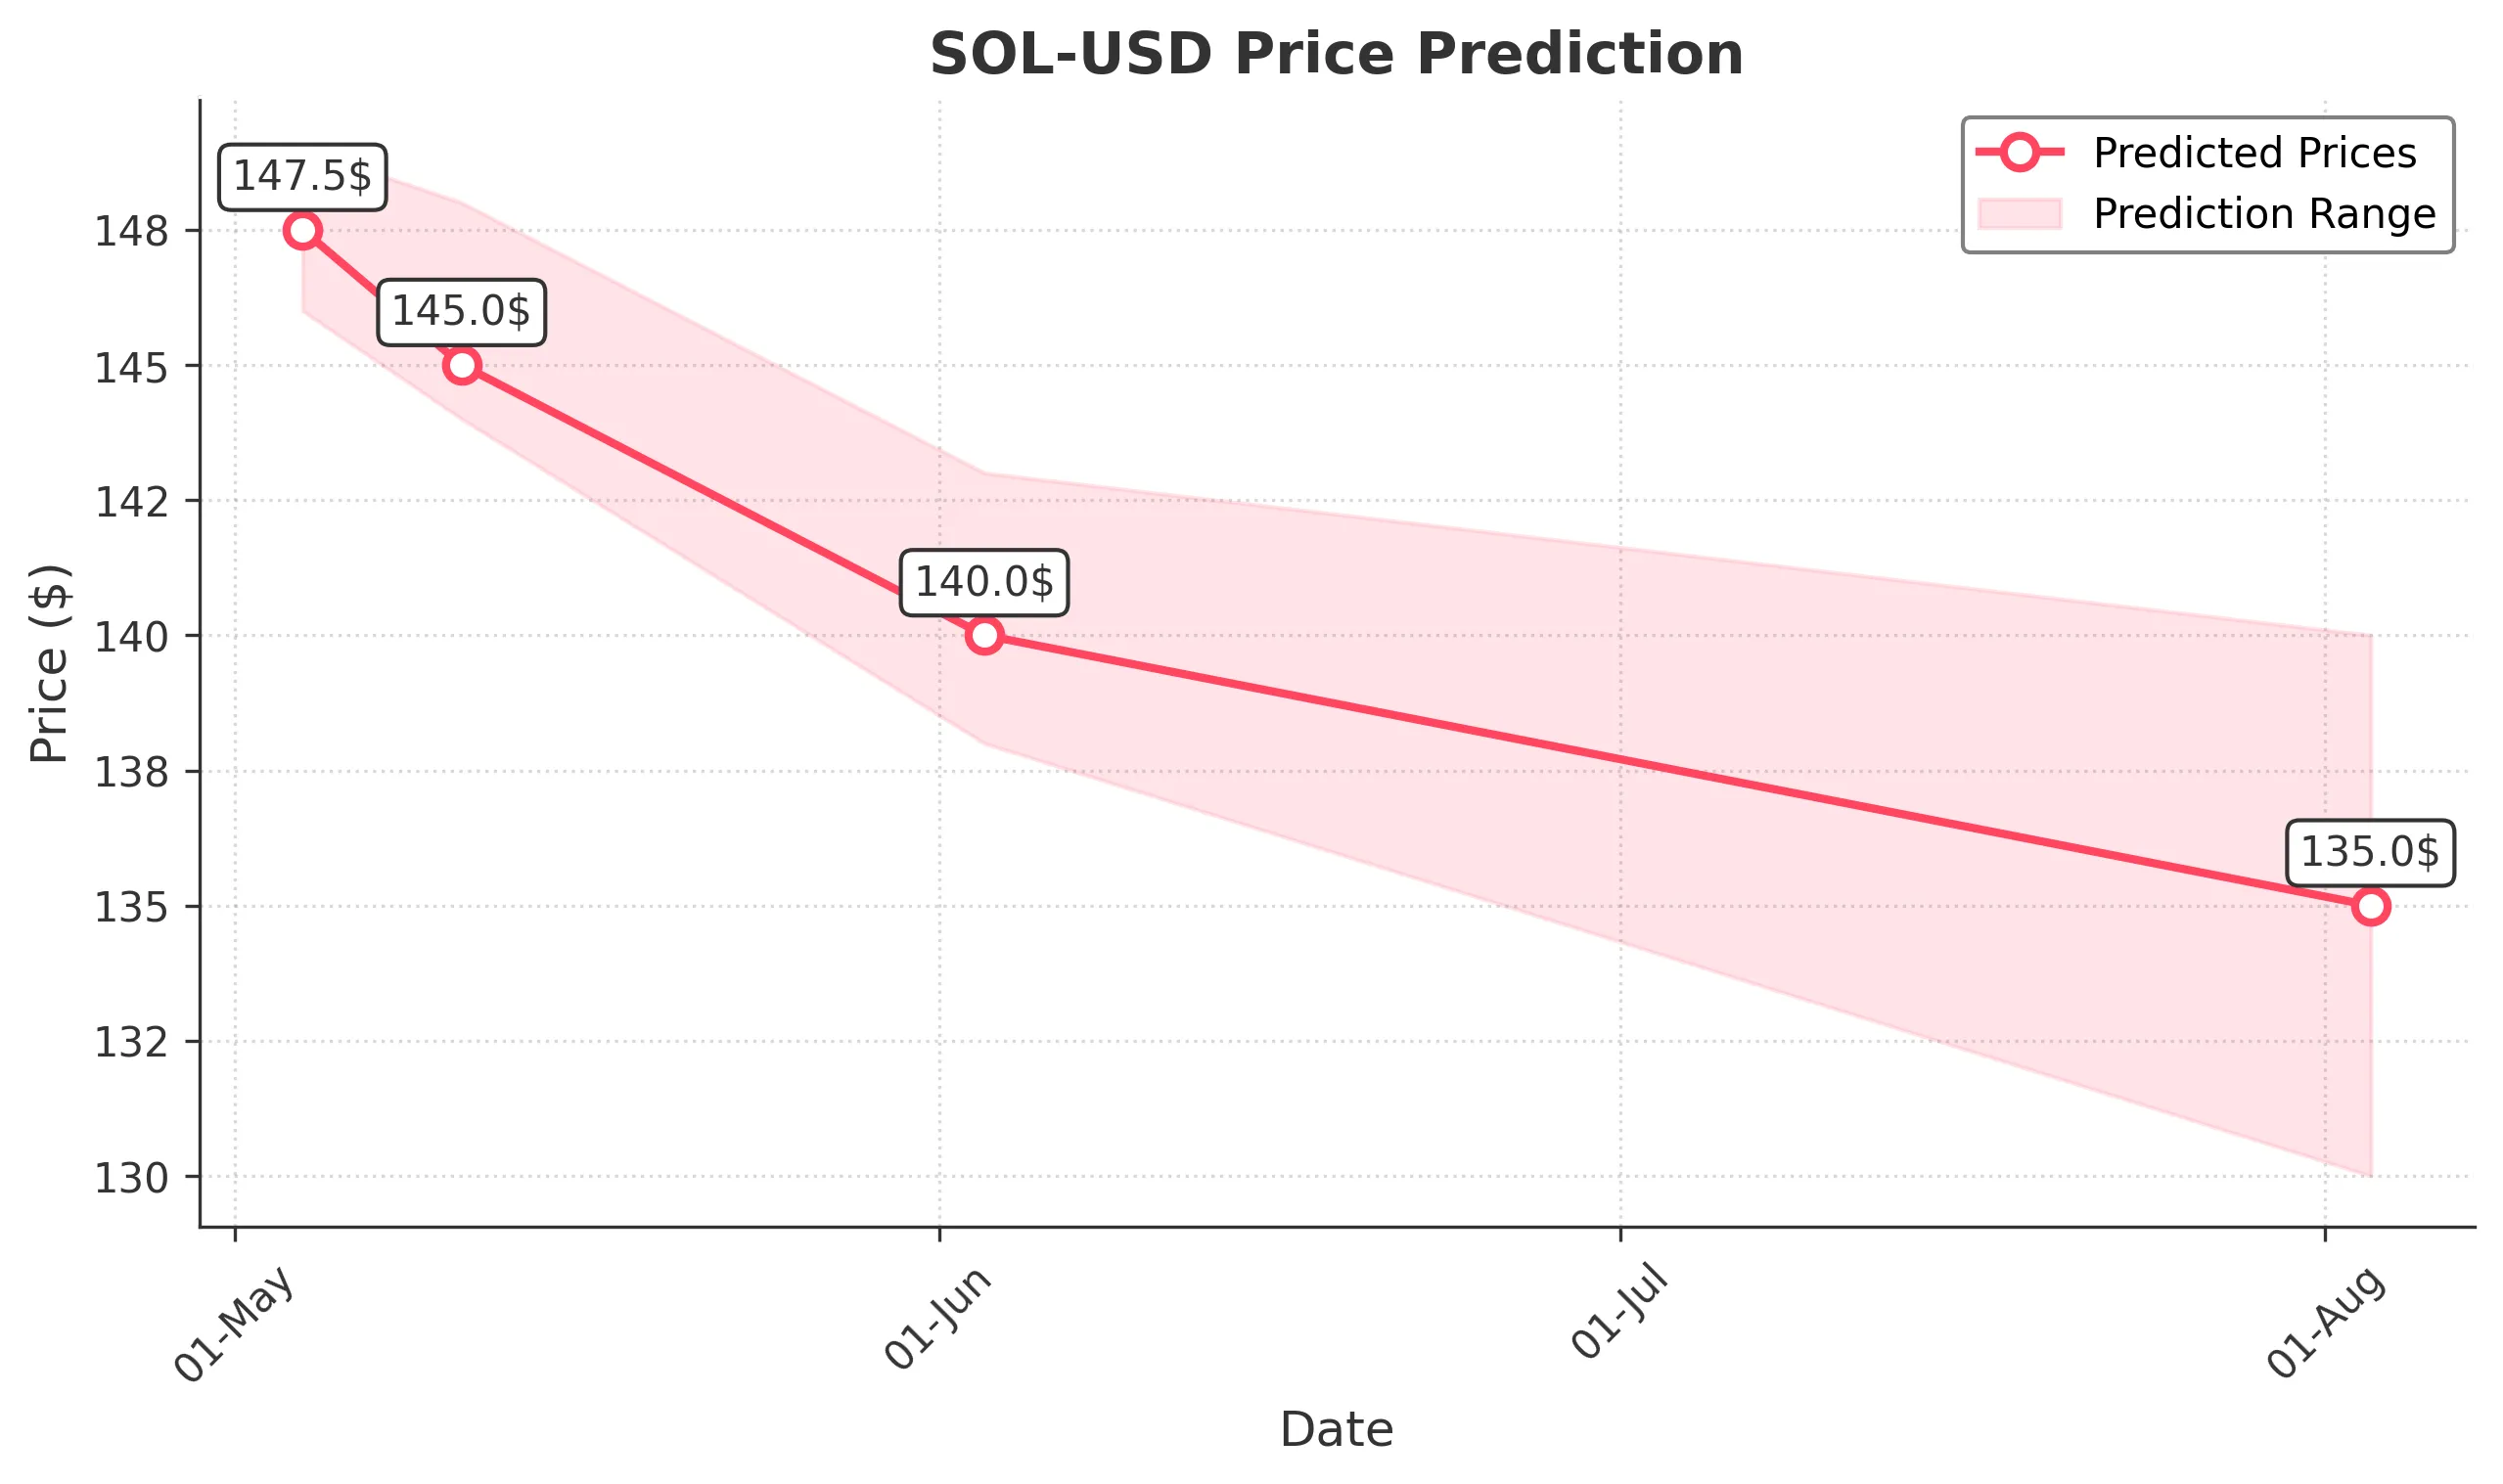
Target: May 4, 2025$147.5
$147.8
$149
$146
Description
The stock shows a slight bearish trend with recent lower highs and lower lows. RSI indicates oversold conditions, suggesting a potential bounce. However, MACD is bearish, and volume is decreasing, indicating caution.
Analysis
Over the past 3 months, SOL-USD has experienced significant volatility, with a bearish trend recently. Key support at $145 and resistance at $150. Technical indicators show mixed signals, with RSI suggesting oversold conditions but MACD indicating bearish momentum.
Confidence Level
Potential Risks
Market volatility and external news could impact the price significantly.
1 Week Prediction
Target: May 11, 2025$145
$146.5
$148
$144
Description
The bearish trend may continue as the stock struggles to maintain upward momentum. Volume analysis shows decreasing interest, and the MACD remains negative. A potential support level at $144 could be tested.
Analysis
The stock has been in a bearish phase, with significant price drops and low trading volumes. Key support at $144 is critical, while resistance remains at $150. Technical indicators suggest a lack of bullish momentum.
Confidence Level
Potential Risks
Unforeseen market events or news could lead to sudden price changes.
1 Month Prediction
Target: June 3, 2025$140
$145
$143
$138
Description
Continued bearish sentiment may push the price lower, with potential testing of support levels. The RSI indicates oversold conditions, but MACD remains bearish, suggesting further downside risk.
Analysis
The stock has shown a consistent downtrend, with significant resistance at $145. Volume patterns indicate reduced interest, and technical indicators suggest a bearish outlook. The market's overall sentiment remains cautious.
Confidence Level
Potential Risks
Market sentiment can shift rapidly, impacting predictions.
3 Months Prediction
Target: August 3, 2025$135
$138
$140
$130
Description
If the bearish trend continues, the price may decline further. Key support at $130 is critical. The MACD and RSI suggest ongoing bearish momentum, indicating potential for further declines.
Analysis
The stock's performance has been predominantly bearish, with significant price drops and low trading volumes. Key support at $130 is crucial, while resistance remains at $145. Technical indicators suggest a lack of bullish momentum.
Confidence Level
Potential Risks
Long-term predictions are highly uncertain due to market volatility and external factors.