SOL-USD Trading Predictions
1 Day Prediction
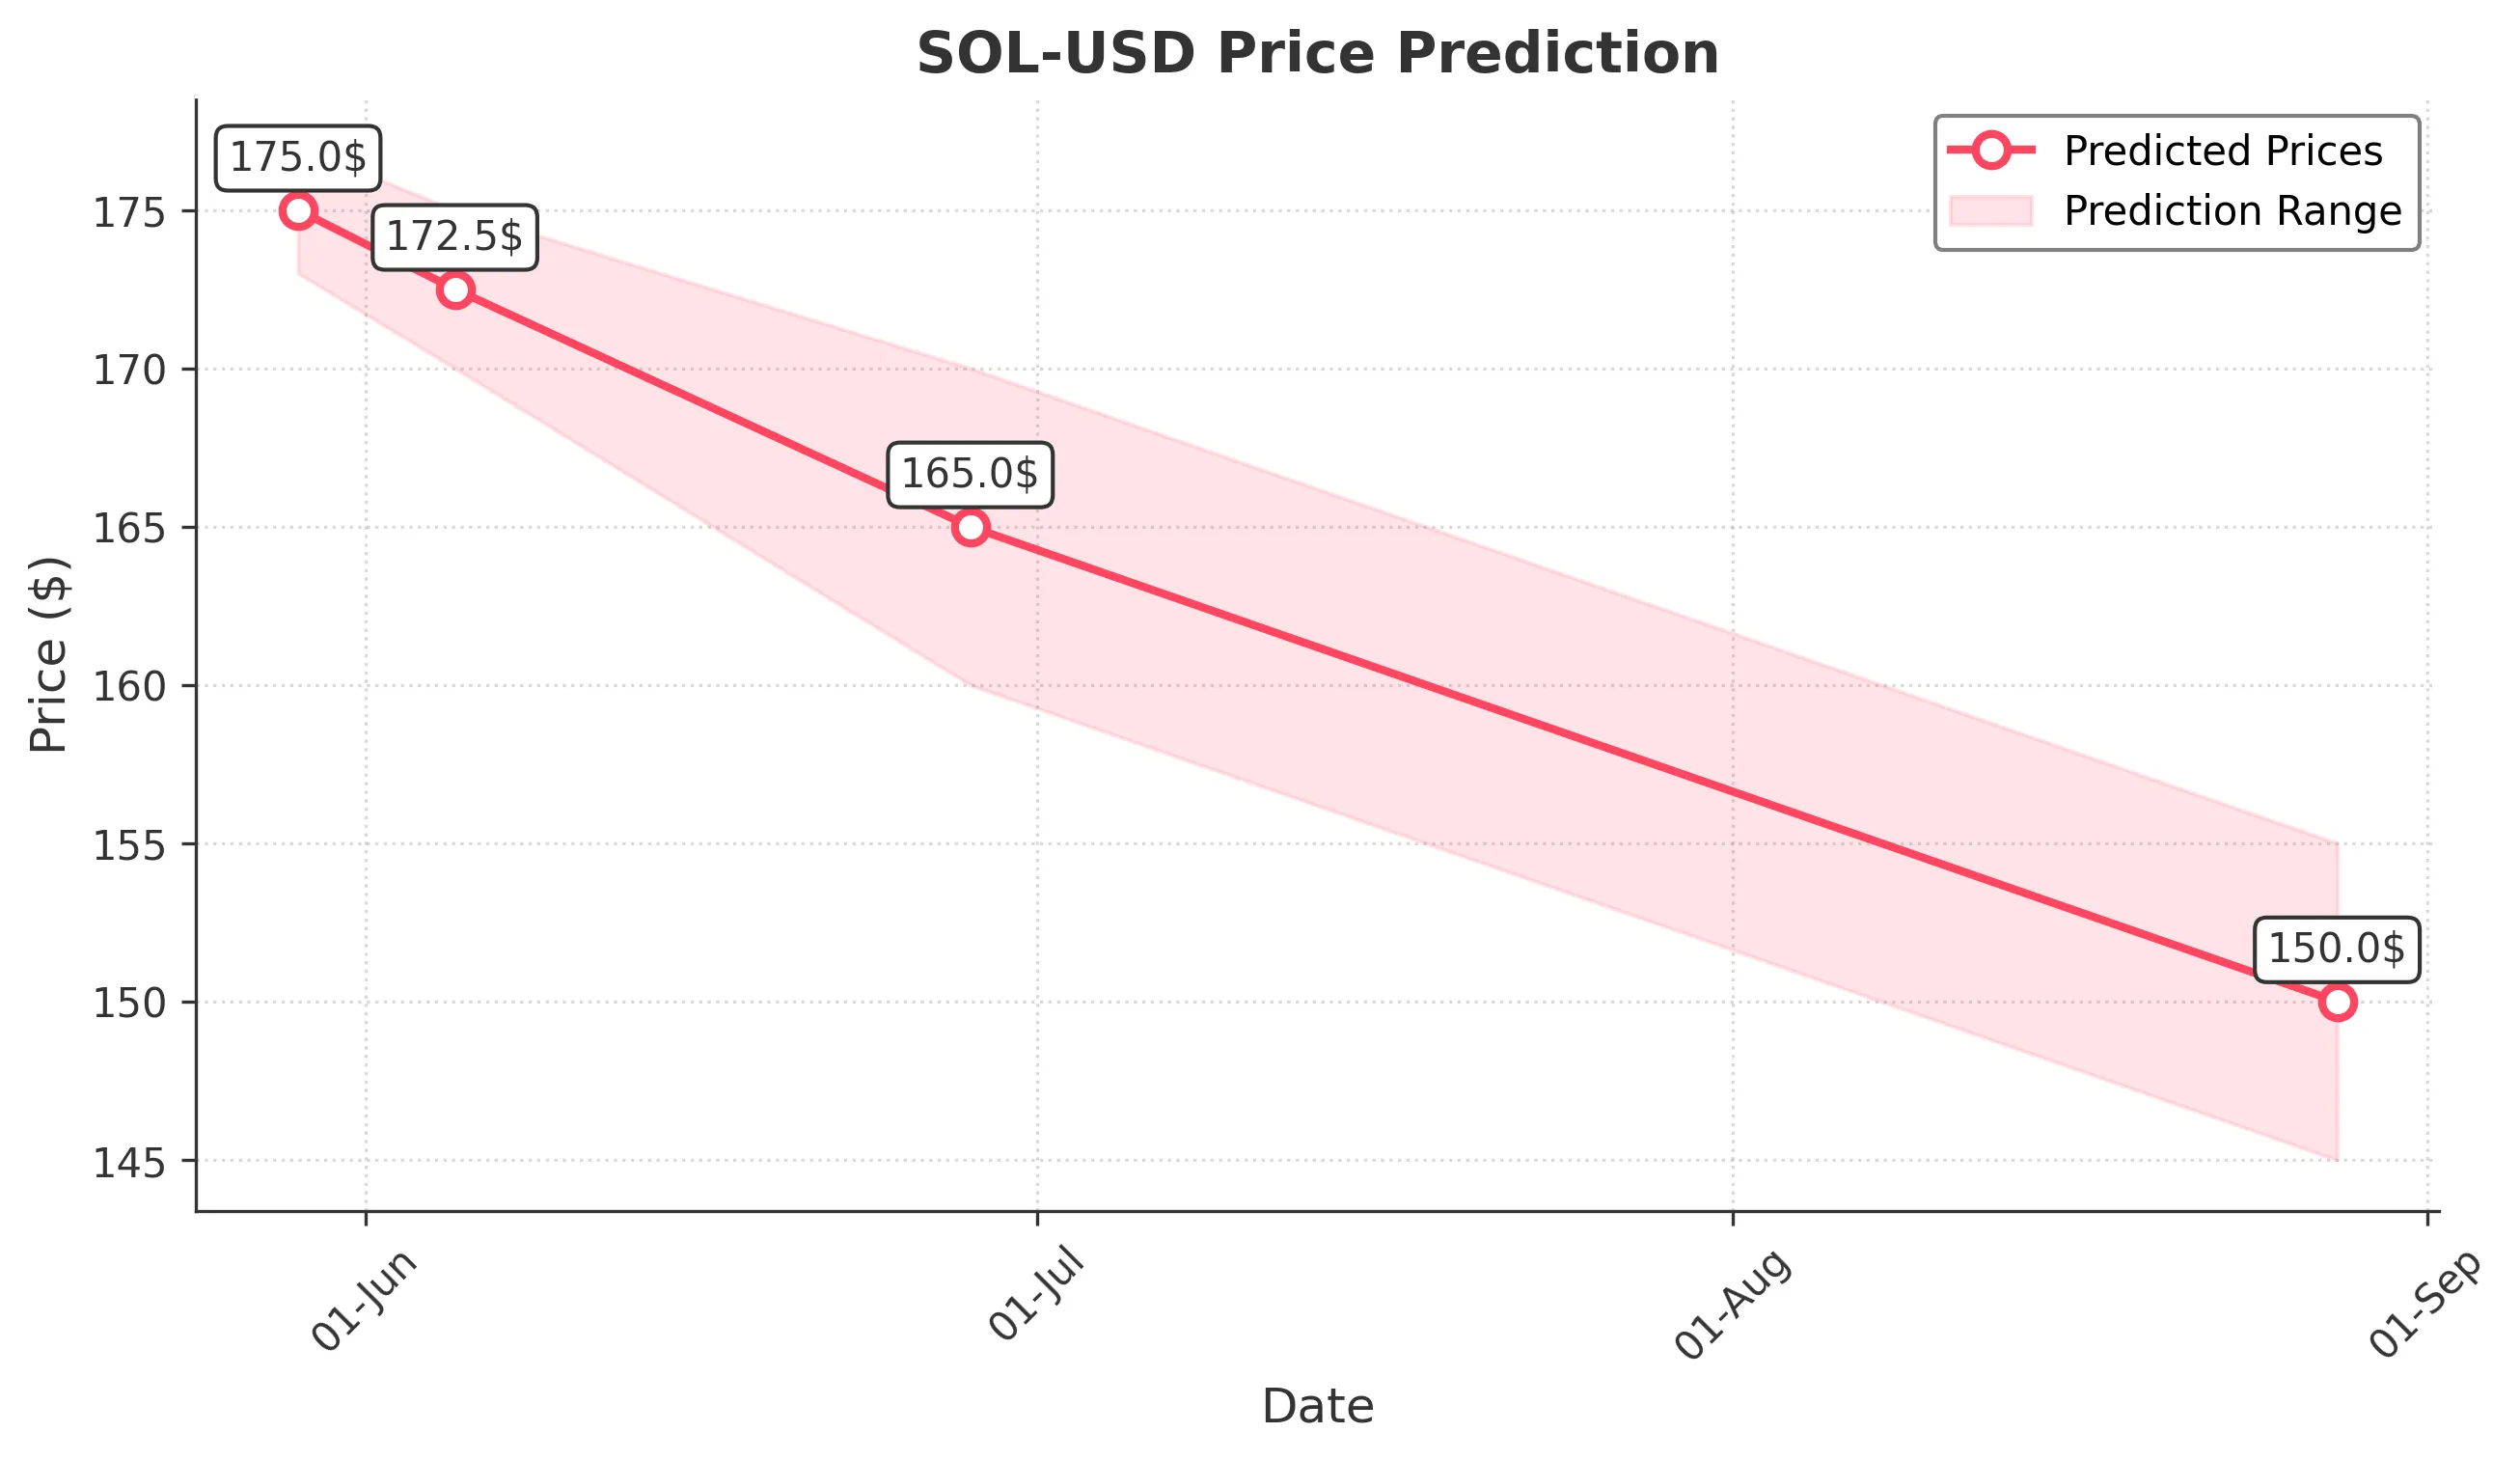
Target: May 29, 2025$175
$174
$177
$173
Description
The stock shows a slight bullish trend with recent upward momentum. RSI indicates overbought conditions, suggesting a potential pullback. However, strong support at 173.00 may hold. Volume remains stable, indicating sustained interest.
Analysis
Over the past 3 months, SOL-USD has shown significant volatility with a bullish trend recently. Key resistance at 180.00 and support around 173.00. Moving averages indicate upward momentum, but RSI suggests caution. Volume spikes on upward days indicate strong buying interest.
Confidence Level
Potential Risks
Potential for a reversal exists due to overbought RSI. Market sentiment may shift quickly based on external news.
1 Week Prediction
Target: June 5, 2025$172.5
$175
$175
$170
Description
Expect a slight pullback as the stock approaches resistance levels. The MACD shows signs of divergence, indicating potential weakness. Volume may increase as traders react to price movements.
Analysis
The stock has been in a bullish phase but is approaching key resistance levels. Recent candlestick patterns suggest indecision. Volume analysis shows spikes during upward movements, indicating strong buying interest, but caution is warranted as the stock may face resistance.
Confidence Level
Potential Risks
Market volatility and external factors could lead to unexpected price movements. Watch for news that may impact sentiment.
1 Month Prediction
Target: June 28, 2025$165
$170
$170
$160
Description
A bearish trend may develop as the stock faces resistance. The RSI is expected to decline, indicating weakening momentum. Volume may decrease as traders take profits.
Analysis
The stock has shown strong performance but is now facing resistance. Key support at 160.00 may be tested. Technical indicators suggest a potential reversal, and volume patterns indicate profit-taking. Overall, a cautious approach is advised.
Confidence Level
Potential Risks
Uncertainty in market conditions and potential macroeconomic events could impact the prediction. Watch for changes in sentiment.
3 Months Prediction
Target: August 28, 2025$150
$155
$155
$145
Description
Expect continued bearish pressure as the stock may test lower support levels. The MACD indicates a bearish crossover, and volume may increase as selling pressure builds.
Analysis
The stock has shown volatility with a recent bullish phase but is now facing potential bearish trends. Key support levels are critical, and technical indicators suggest weakening momentum. Volume patterns indicate potential selling pressure, warranting caution.
Confidence Level
Potential Risks
Market conditions are unpredictable, and external factors could lead to significant price changes. Watch for economic indicators.