SOL-USD Trading Predictions
1 Day Prediction
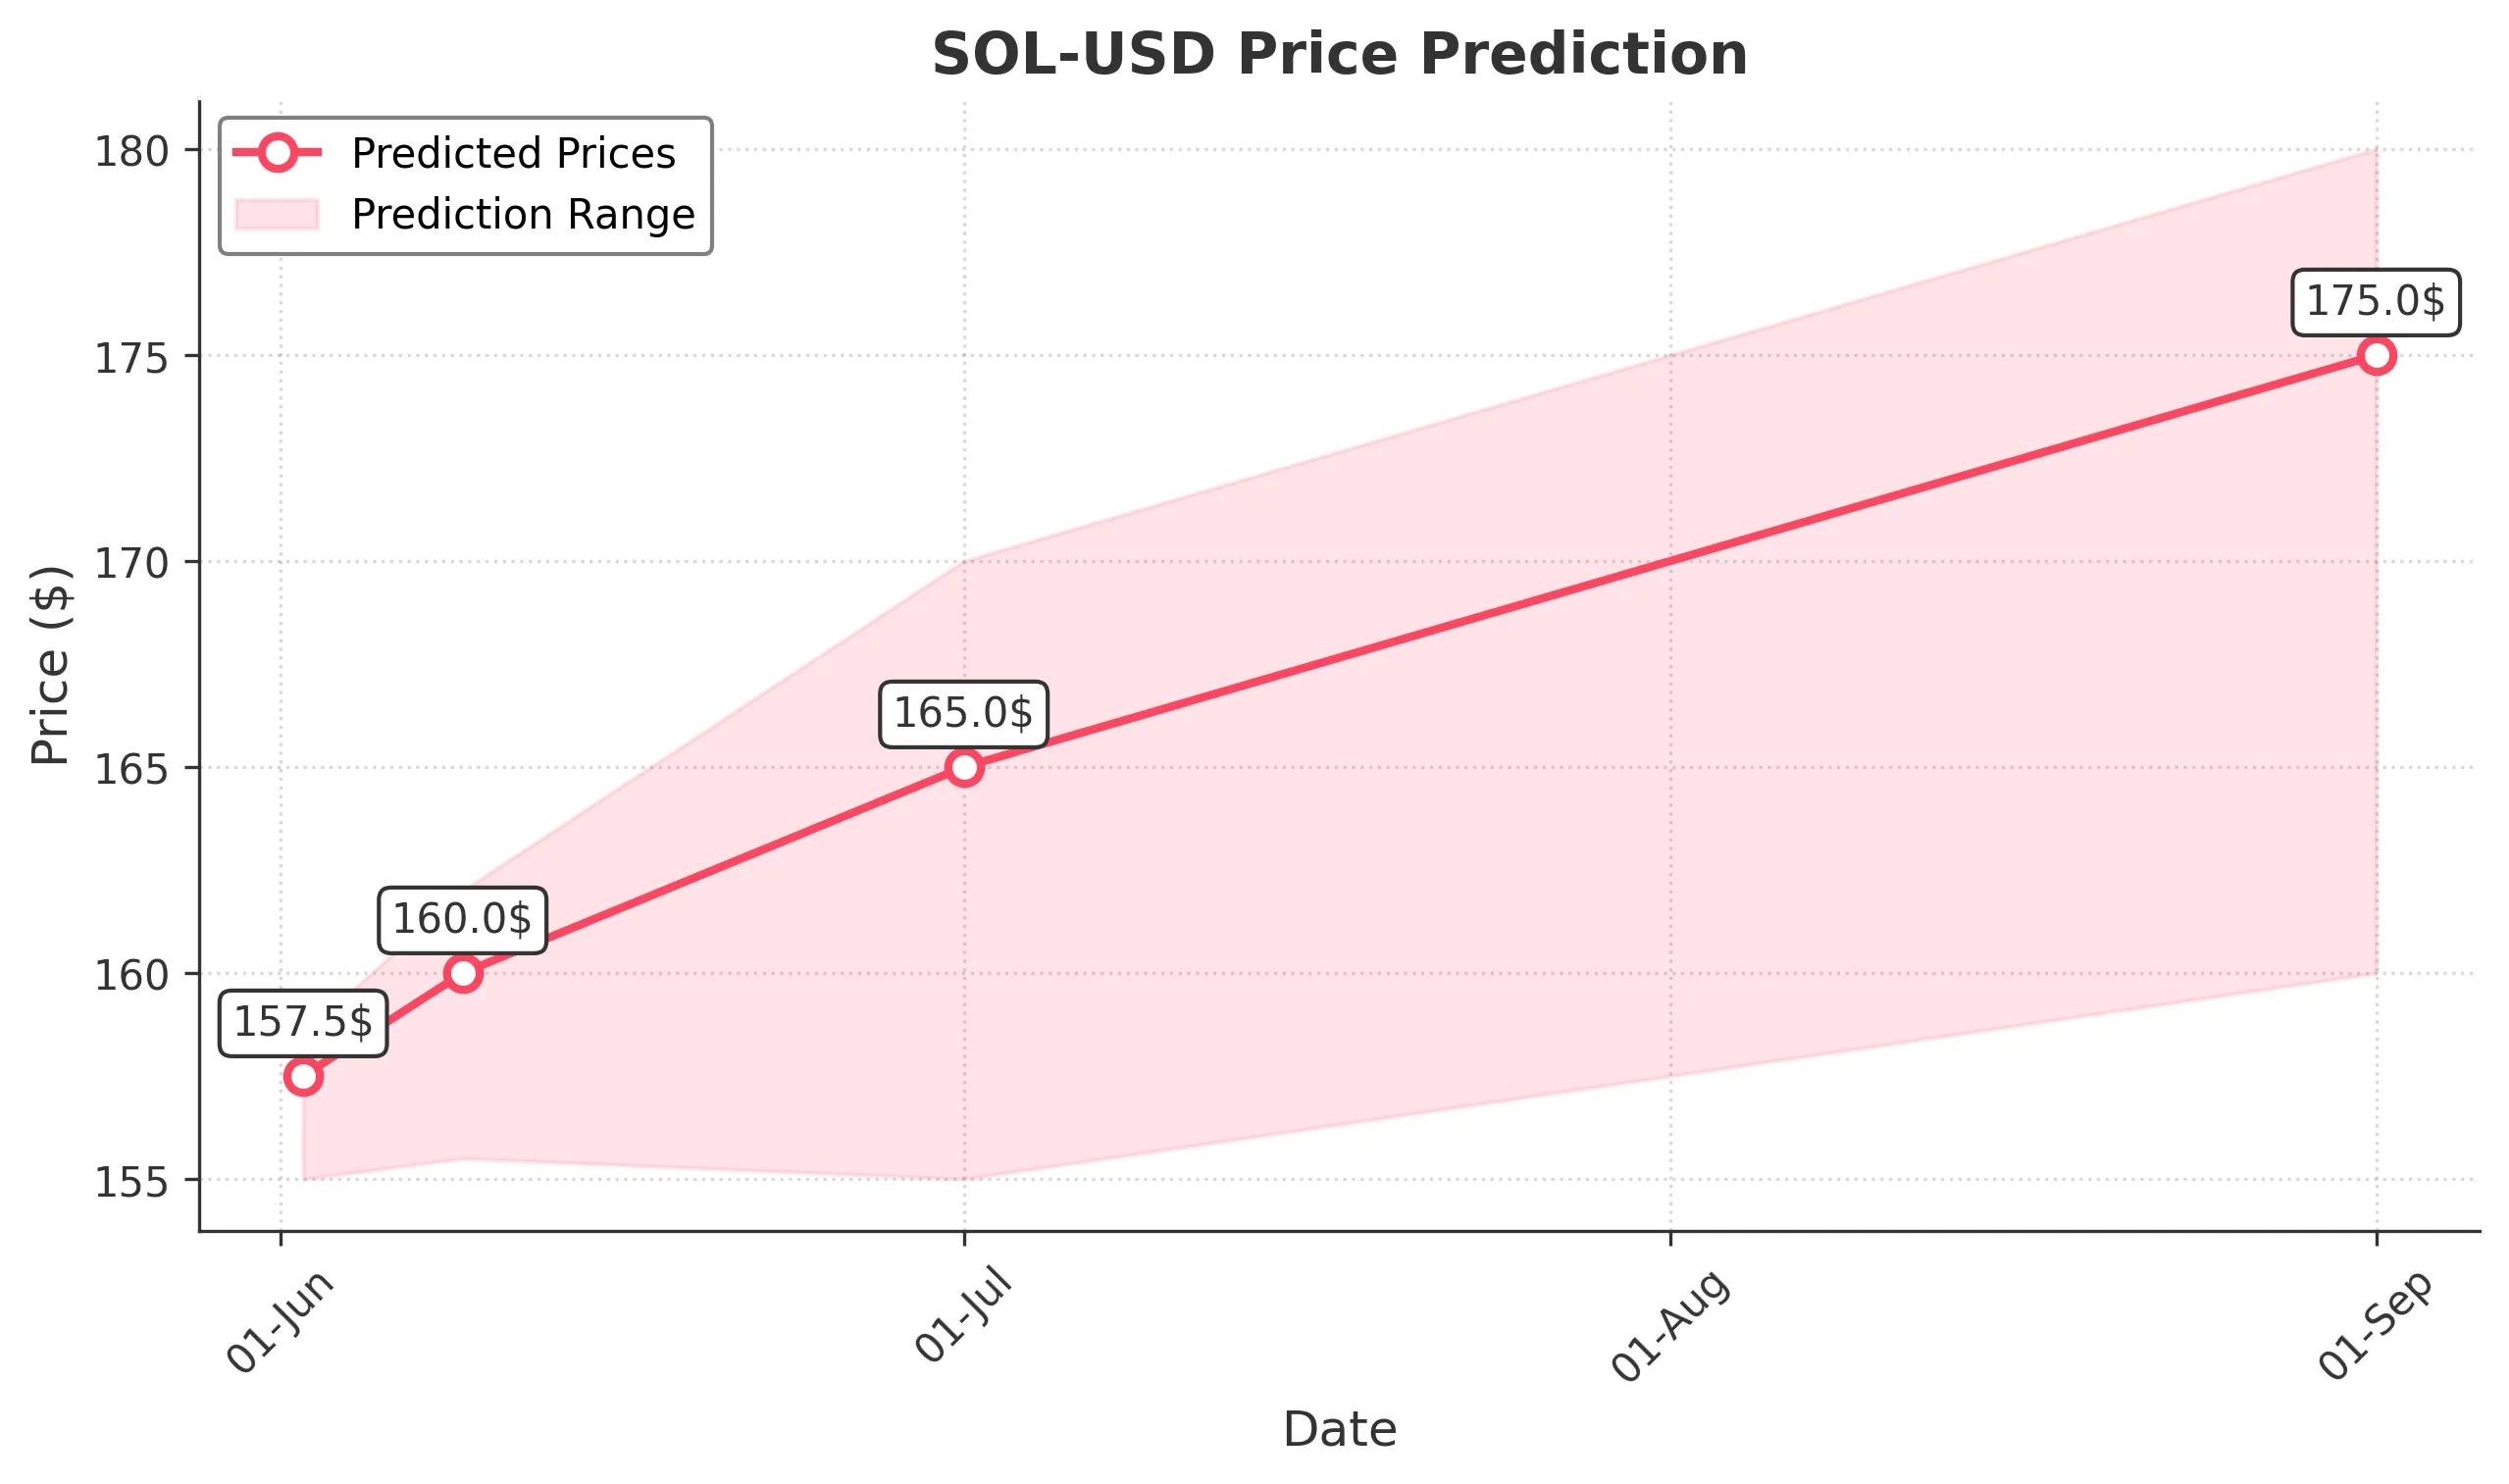
Target: June 2, 2025$157.5
$156.5
$158.5
$155
Description
The stock shows a slight bullish trend with a potential close around 157.500. The RSI is neutral, and MACD indicates a potential upward momentum. However, recent volatility suggests caution.
Analysis
Over the past 3 months, SOL-USD has shown a mix of bullish and bearish trends, with significant support at 155 and resistance around 180. Recent volume spikes indicate increased interest, but volatility remains high.
Confidence Level
Potential Risks
Market sentiment could shift due to macroeconomic news or earnings reports, which may impact the price unexpectedly.
1 Week Prediction
Target: June 9, 2025$160
$158
$162
$155.5
Description
Expecting a gradual rise to 160.000 as bullish sentiment builds. The 50-day moving average supports this trend, but watch for potential resistance at 162.000.
Analysis
The stock has been fluctuating, with a recent bullish phase. Key support at 155.500 and resistance at 162.000 are critical. Volume trends suggest increased buying interest, but caution is warranted.
Confidence Level
Potential Risks
External factors like regulatory news or market corrections could lead to sudden price changes.
1 Month Prediction
Target: July 1, 2025$165
$160
$170
$155
Description
Aiming for a close of 165.000 as the stock consolidates. The bullish trend is supported by Fibonacci retracement levels, but resistance at 170.000 may pose challenges.
Analysis
SOL-USD has shown resilience with a bullish trend. Key support at 155.000 and resistance at 170.000 are pivotal. Volume analysis indicates strong buying pressure, but external factors could impact stability.
Confidence Level
Potential Risks
Market volatility and potential profit-taking could lead to fluctuations around this target.
3 Months Prediction
Target: September 1, 2025$175
$170
$180
$160
Description
Forecasting a close of 175.000 as the stock continues its upward trajectory. The MACD indicates sustained bullish momentum, but watch for potential resistance at 180.000.
Analysis
The stock has been on a bullish trend with significant support at 160.000 and resistance at 180.000. Volume patterns suggest strong interest, but macroeconomic factors could introduce volatility.
Confidence Level
Potential Risks
Long-term predictions are subject to market shifts and economic conditions that could alter the trajectory.