SOL-USD Trading Predictions
1 Day Prediction
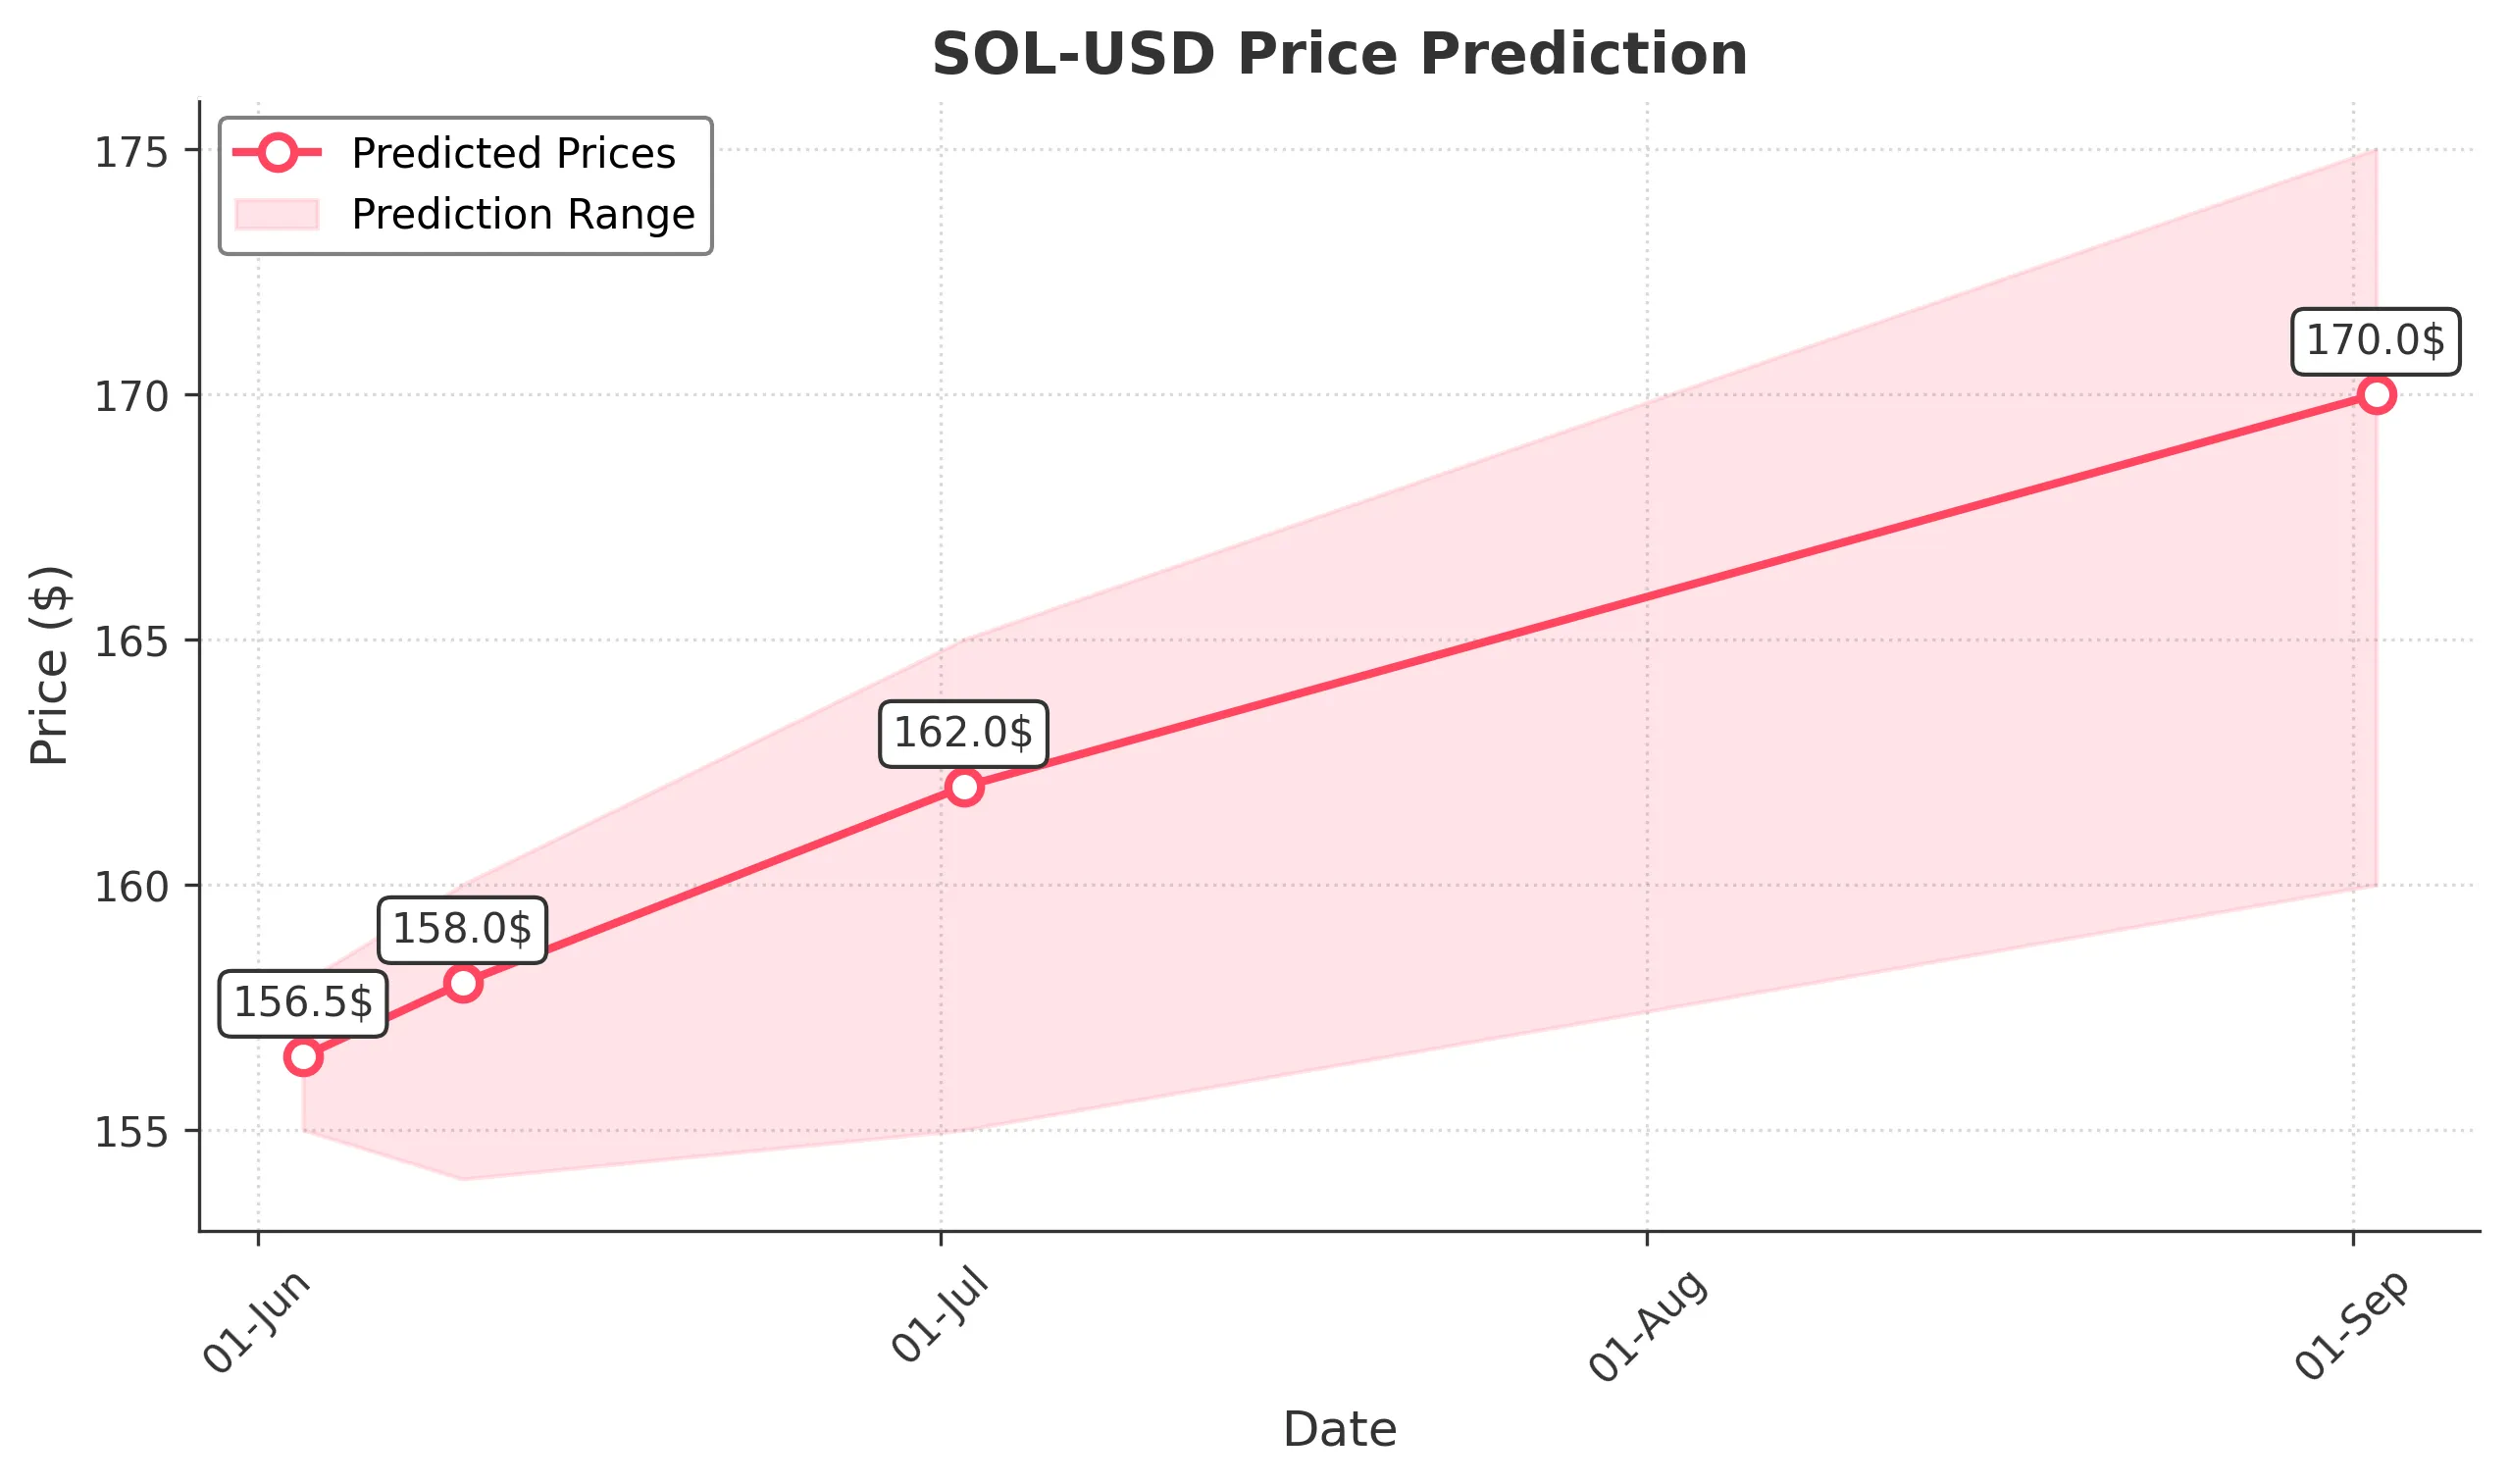
Target: June 3, 2025$156.5
$156
$158
$155
Description
The stock shows a slight bullish trend with a recent Doji pattern indicating indecision. RSI is neutral, and MACD is close to crossing above the signal line, suggesting potential upward momentum. However, volatility remains a concern.
Analysis
Over the past 3 months, SOL-USD has experienced significant volatility, with a recent bullish trend after a bearish phase. Key support at $155 and resistance at $160. Volume spikes indicate strong interest, but the market remains sensitive to external factors.
Confidence Level
Potential Risks
Market sentiment could shift quickly due to macroeconomic news or earnings reports, which may impact the prediction.
1 Week Prediction
Target: June 10, 2025$158
$156.5
$160
$154
Description
The stock is expected to continue its upward trend, supported by a bullish MACD crossover and RSI indicating strength. However, the recent high volatility suggests caution, as external factors could lead to sudden price changes.
Analysis
The last three months show a recovery from lows, with a bullish sentiment emerging. Key resistance at $160 and support at $155. The stock's performance is influenced by broader market trends and investor sentiment.
Confidence Level
Potential Risks
Potential market corrections or negative news could reverse the trend, impacting the accuracy of this prediction.
1 Month Prediction
Target: July 2, 2025$162
$158
$165
$155
Description
The stock is likely to maintain a bullish trend, with strong support at $155 and resistance at $165. The RSI indicates potential overbought conditions, suggesting a pullback could occur. Volume trends support upward movement.
Analysis
SOL-USD has shown resilience with a bullish trend, supported by increasing volume and positive market sentiment. Key levels to watch are $155 for support and $165 for resistance, with potential for further gains if momentum continues.
Confidence Level
Potential Risks
Market volatility and external economic factors could lead to unexpected price movements, affecting the prediction.
3 Months Prediction
Target: September 2, 2025$170
$162
$175
$160
Description
Long-term indicators suggest a bullish outlook, with potential for the stock to reach $170. However, the RSI indicates overbought conditions, and a correction could occur. Market sentiment remains a key driver.
Analysis
The stock has shown a strong recovery, but the potential for volatility remains high. Key support at $160 and resistance at $175. The overall market environment and investor sentiment will play crucial roles in determining future price movements.
Confidence Level
Potential Risks
Unforeseen macroeconomic events or shifts in market sentiment could lead to significant price fluctuations, impacting the prediction.