SOL-USD Trading Predictions
1 Day Prediction
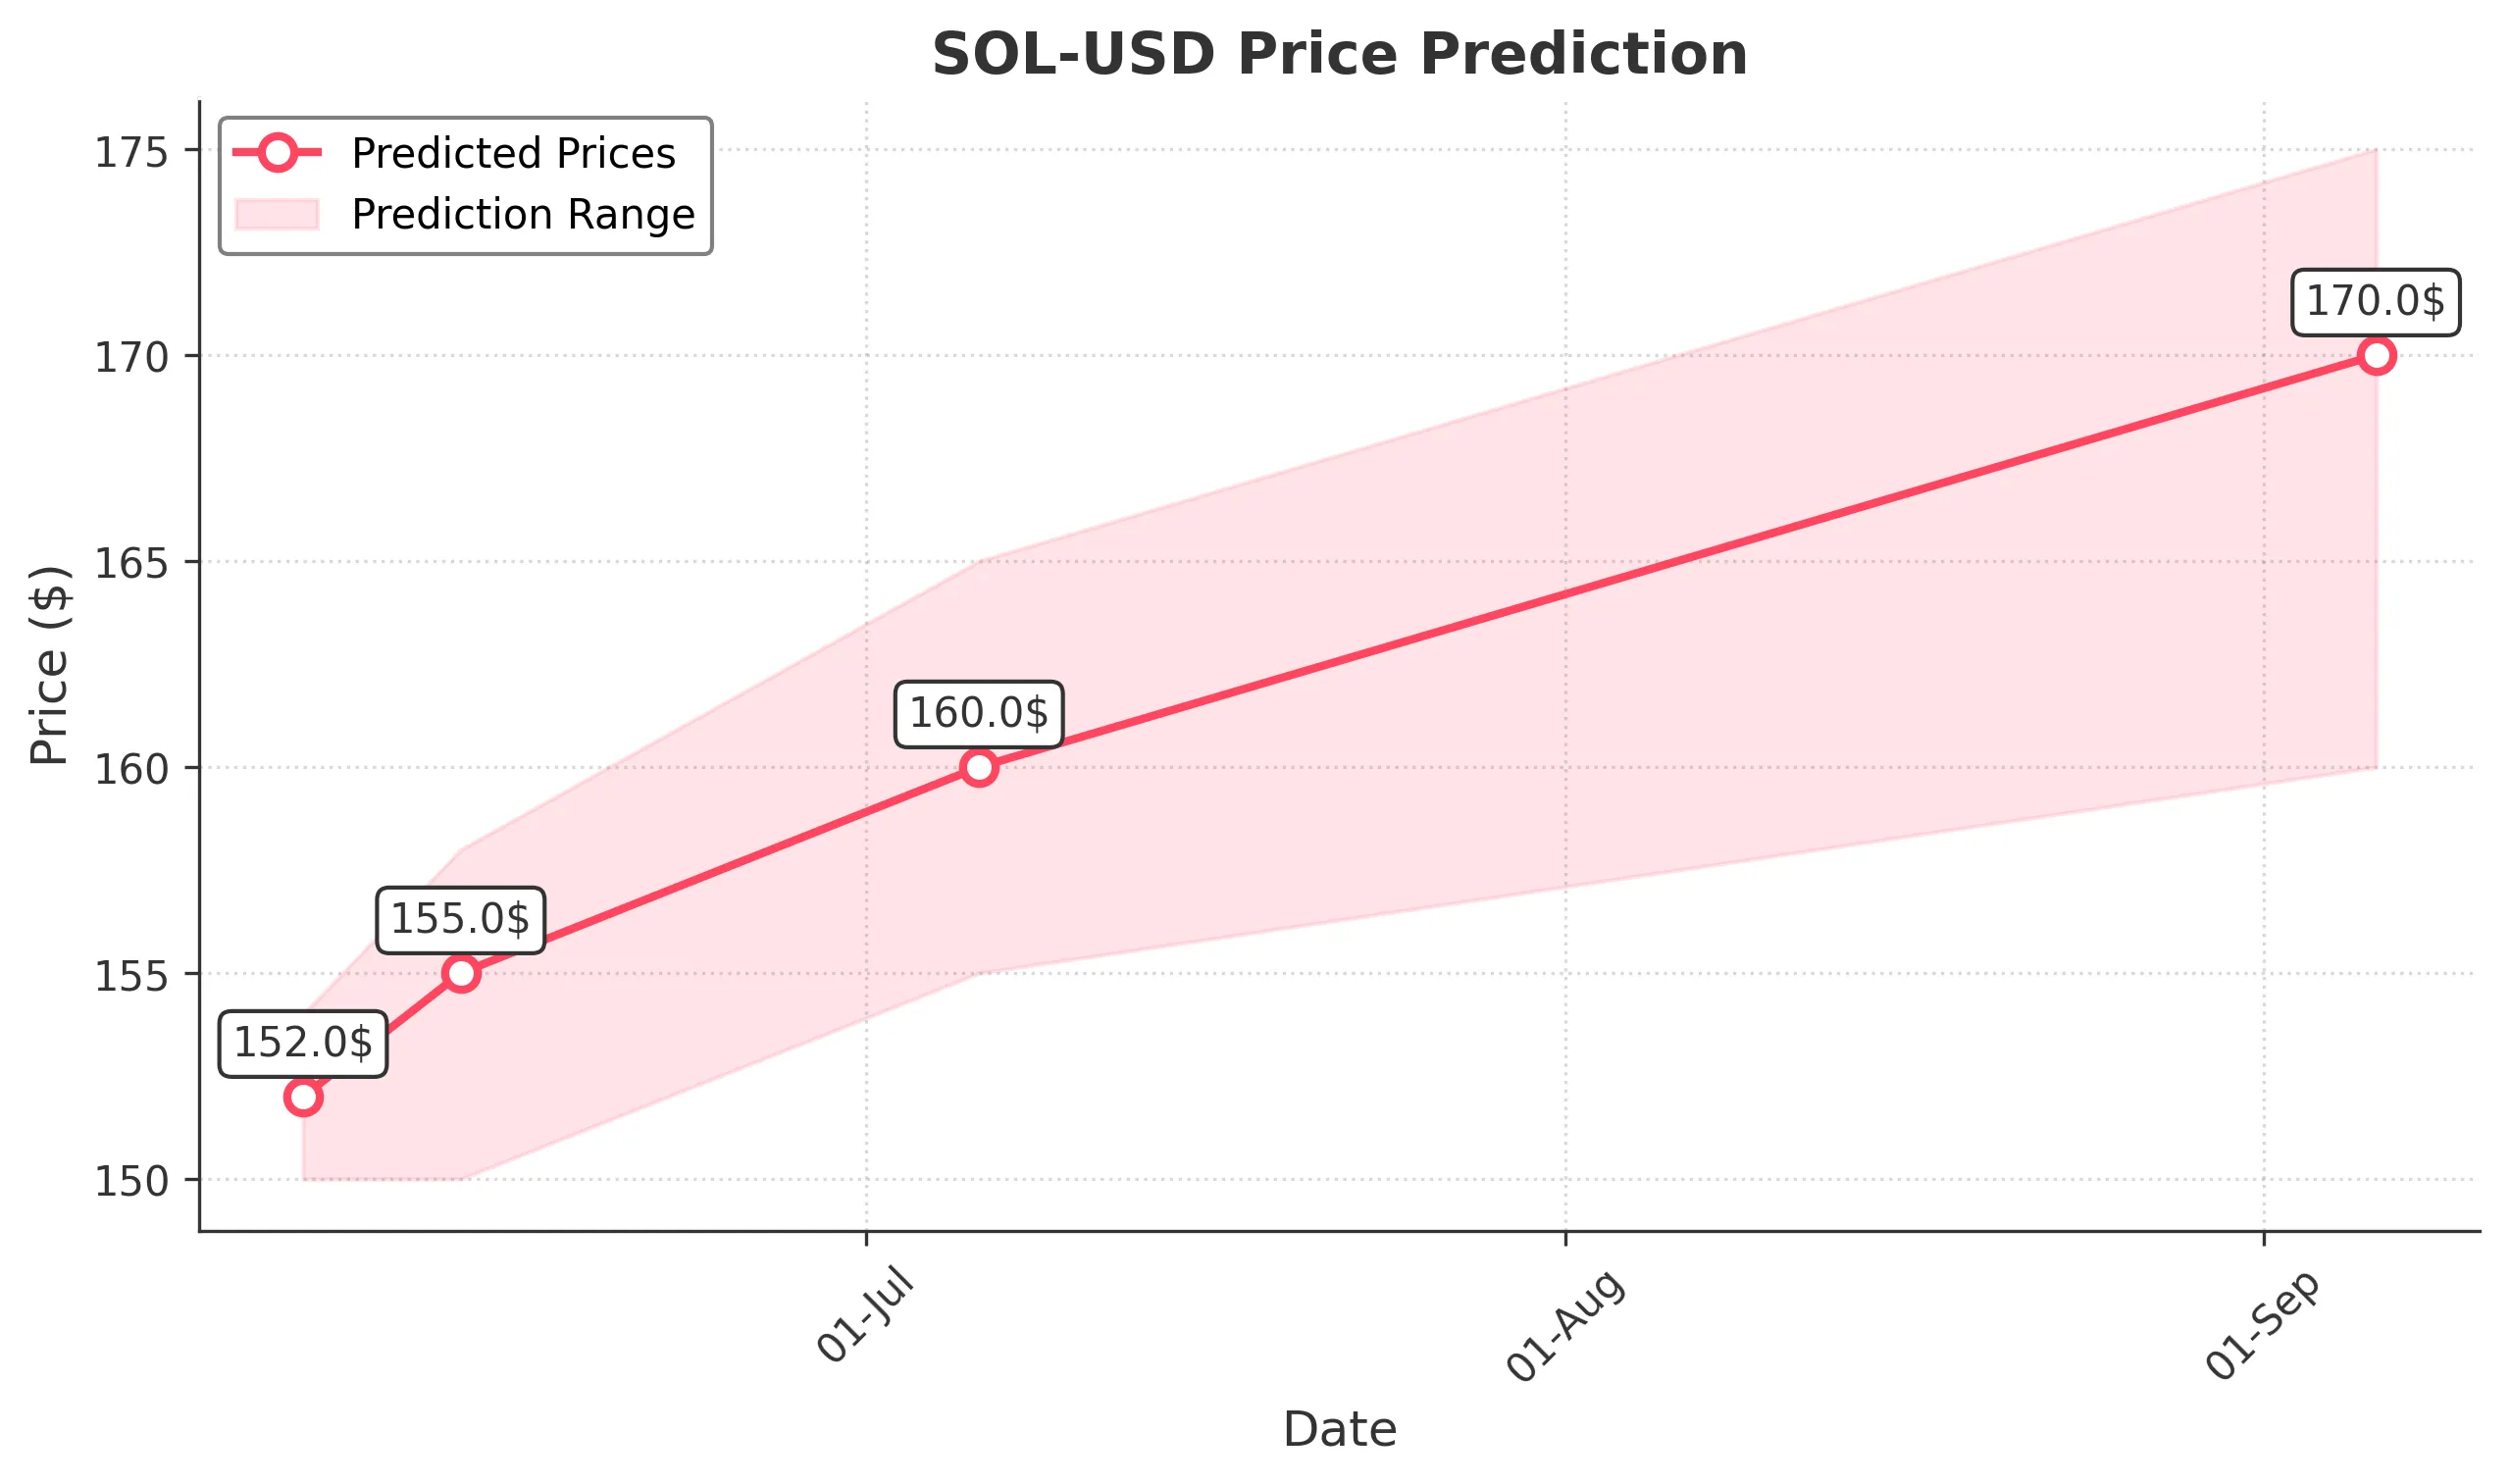
Target: June 6, 2025$152
$152.5
$154
$150
Description
The stock shows a slight bearish trend with recent lower highs and lower lows. RSI indicates oversold conditions, suggesting a potential bounce. However, MACD is bearish, and volume is decreasing, indicating caution.
Analysis
Over the past 3 months, SOL-USD has shown a bearish trend with significant volatility. Key support at $150 and resistance at $160. Recent volume spikes indicate selling pressure. Technical indicators suggest a potential short-term bounce, but overall sentiment remains cautious.
Confidence Level
Potential Risks
Market volatility and external news could impact the prediction. A sudden bullish reversal is possible if sentiment shifts.
1 Week Prediction
Target: June 13, 2025$155
$153
$158
$150
Description
A potential recovery is anticipated as the stock may find support around $150. The RSI is improving, and a bullish divergence is forming. However, MACD remains bearish, indicating mixed signals.
Analysis
The stock has been in a downtrend, but recent price action shows signs of stabilization. Key support at $150 and resistance at $160. Technical indicators suggest a possible short-term recovery, but overall market sentiment remains cautious.
Confidence Level
Potential Risks
Unforeseen macroeconomic events or negative news could hinder recovery. Watch for volume trends to confirm bullish momentum.
1 Month Prediction
Target: July 6, 2025$160
$158
$165
$155
Description
If the bullish momentum continues, the stock could reach $160. The RSI is expected to recover, and MACD may cross bullish. However, resistance at $165 could pose challenges.
Analysis
The stock has shown volatility with a bearish trend recently. Key support at $150 and resistance at $165. Technical indicators suggest potential recovery, but overall market conditions remain uncertain.
Confidence Level
Potential Risks
Market sentiment can shift quickly, and external factors may impact the stock's performance. Watch for any signs of reversal.
3 Months Prediction
Target: September 6, 2025$170
$165
$175
$160
Description
If the bullish trend continues, the stock could reach $170. Positive market sentiment and improved technical indicators may support this move. However, resistance at $175 could limit gains.
Analysis
The stock has been volatile with a bearish trend recently. Key support at $150 and resistance at $175. Technical indicators suggest potential recovery, but overall market conditions remain uncertain.
Confidence Level
Potential Risks
Long-term predictions are uncertain due to potential market volatility and external economic factors. Watch for changes in sentiment.