SOL-USD Trading Predictions
1 Day Prediction
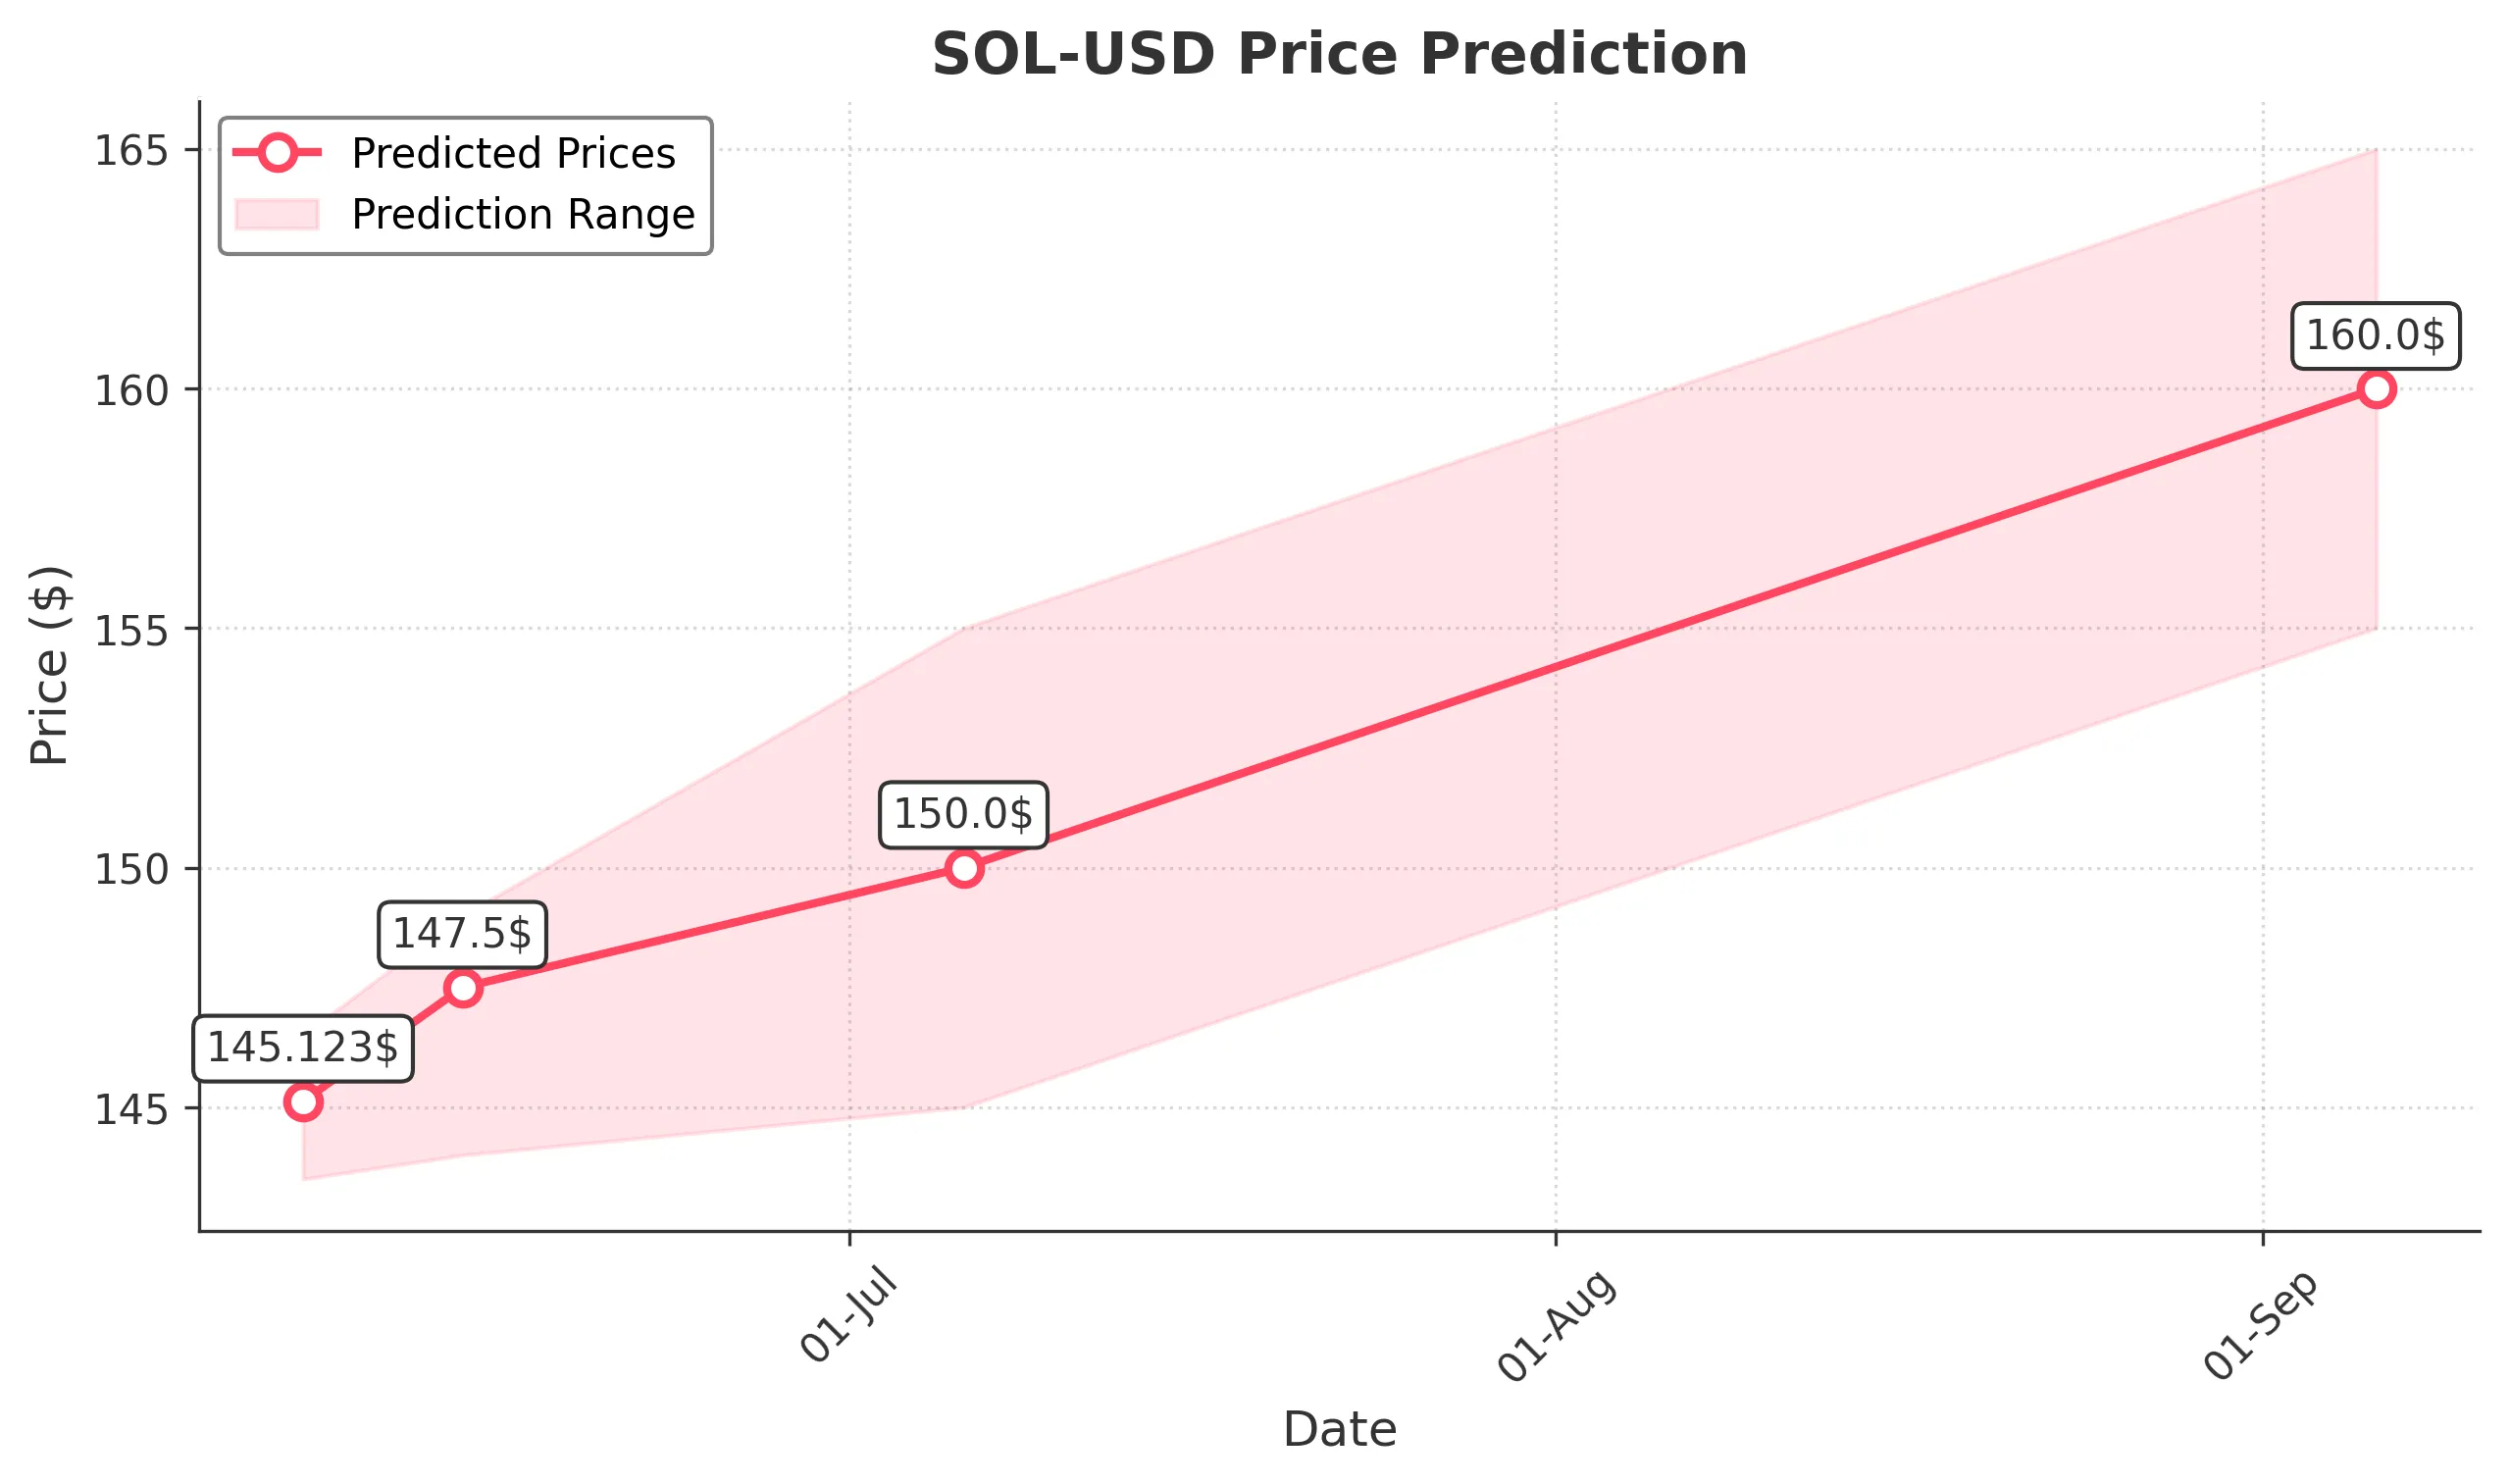
Target: June 7, 2025$145.123
$144.8
$146.5
$143.5
Description
The stock shows a slight bullish trend with a potential close around 145.123. The RSI indicates oversold conditions, while MACD suggests a bullish crossover. However, recent volatility and market sentiment may lead to fluctuations.
Analysis
Over the past 3 months, SOL-USD has shown a bearish trend with significant price drops. Key support is around 140, while resistance is near 160. Volume spikes indicate strong trading interest, but recent bearish patterns suggest caution.
Confidence Level
Potential Risks
Market volatility and external news could impact the price significantly.
1 Week Prediction
Target: June 14, 2025$147.5
$145.5
$149
$144
Description
Expect a close around 147.500 as the stock may recover slightly. The Bollinger Bands indicate potential upward movement, but the overall bearish sentiment remains a concern.
Analysis
The stock has been volatile, with significant price swings. The recent downtrend has created a bearish sentiment, but short-term recovery signals are emerging. Key resistance at 150 may limit upward movement.
Confidence Level
Potential Risks
Unforeseen market events could reverse the trend, impacting the prediction.
1 Month Prediction
Target: July 6, 2025$150
$148
$155
$145
Description
A potential close of 150.000 suggests a gradual recovery. The MACD shows signs of bullish momentum, but the overall market sentiment remains cautious due to previous declines.
Analysis
The stock has experienced a bearish trend, but recent indicators suggest a possible reversal. Key support at 145 and resistance at 155 will be crucial in determining future price action.
Confidence Level
Potential Risks
Market conditions and external factors could lead to unexpected price movements.
3 Months Prediction
Target: September 6, 2025$160
$158
$165
$155
Description
A projected close of 160.000 indicates a potential recovery phase. The RSI is approaching neutral, suggesting a balance between buyers and sellers, but caution is advised due to previous volatility.
Analysis
The stock has shown significant volatility, with a bearish trend recently. However, if the market stabilizes, there may be opportunities for recovery. Key resistance at 165 will be critical for upward momentum.
Confidence Level
Potential Risks
Long-term predictions are uncertain due to potential market shifts and economic factors.