SOL-USD Trading Predictions
1 Day Prediction
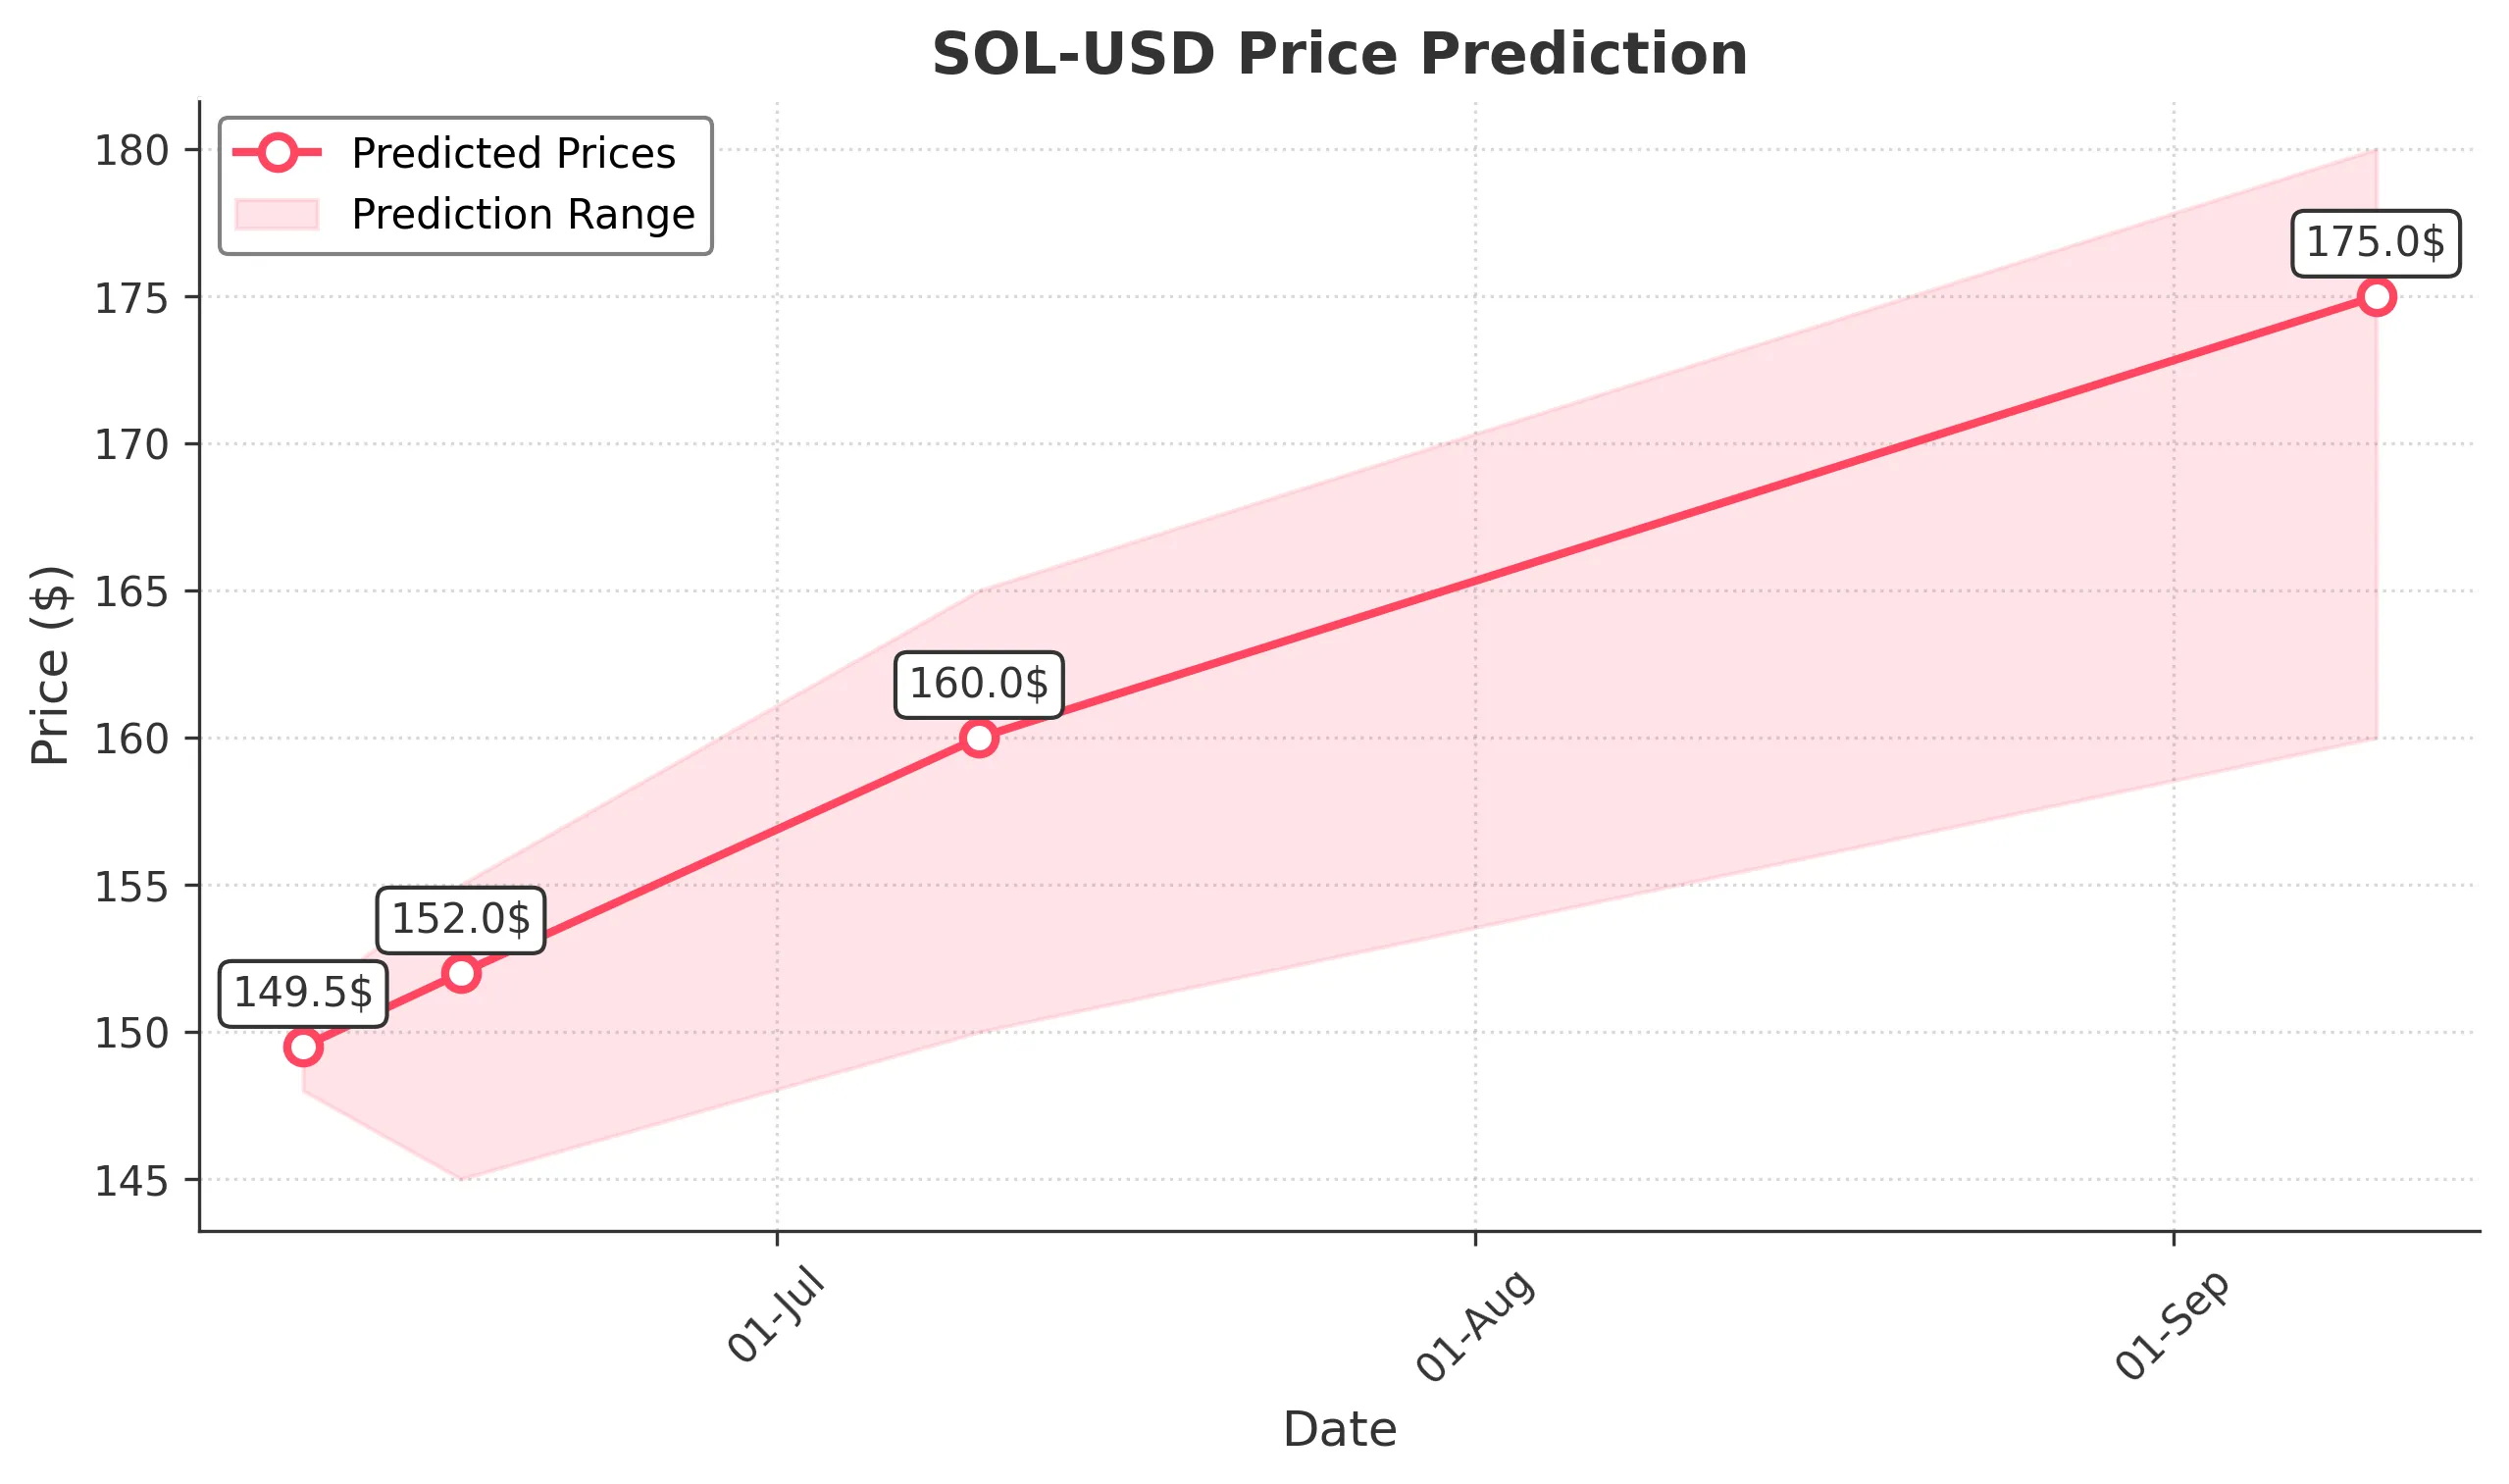
Target: June 10, 2025$149.5
$150
$151
$148
Description
The stock shows a slight bullish trend with a potential close around 149.500. The RSI is neutral, and MACD indicates a potential upward momentum. However, recent volatility suggests caution.
Analysis
Over the past 3 months, SOL-USD has shown a mix of bullish and bearish trends, with significant resistance around 180. Key support levels are at 140. Technical indicators like MACD and RSI suggest indecision, while volume spikes indicate potential volatility.
Confidence Level
Potential Risks
Market sentiment could shift quickly due to external factors, and recent price fluctuations may lead to unexpected movements.
1 Week Prediction
Target: June 17, 2025$152
$150.5
$155
$145
Description
Expect a close around 152.000 as the stock may recover from recent lows. The Bollinger Bands suggest a potential breakout, but caution is advised due to recent bearish patterns.
Analysis
The stock has been volatile, with significant price swings. Key resistance is at 155, while support is around 145. The overall trend remains uncertain, with mixed signals from technical indicators.
Confidence Level
Potential Risks
The market's reaction to macroeconomic news could impact this prediction, and a bearish reversal is possible if selling pressure increases.
1 Month Prediction
Target: July 10, 2025$160
$155
$165
$150
Description
A potential close of 160.000 is expected as the stock may stabilize after recent fluctuations. The MACD shows signs of bullish divergence, indicating a possible upward trend.
Analysis
The stock has shown resilience with a recent upward trend. Key support is at 150, while resistance is at 165. Technical indicators suggest a potential bullish reversal, but caution is warranted.
Confidence Level
Potential Risks
External market conditions and investor sentiment could lead to volatility, impacting the accuracy of this prediction.
3 Months Prediction
Target: September 10, 2025$175
$170
$180
$160
Description
A close around 175.000 is anticipated as the stock may continue its upward trajectory. The Fibonacci retracement levels indicate potential support at 160, with bullish momentum expected.
Analysis
The stock has been on a bullish trend, with significant support at 160 and resistance at 180. Technical indicators suggest a continuation of this trend, but external factors could introduce risks.
Confidence Level
Potential Risks
Market volatility and potential economic shifts could affect this prediction, leading to unexpected price movements.