SOL-USD Trading Predictions
1 Day Prediction
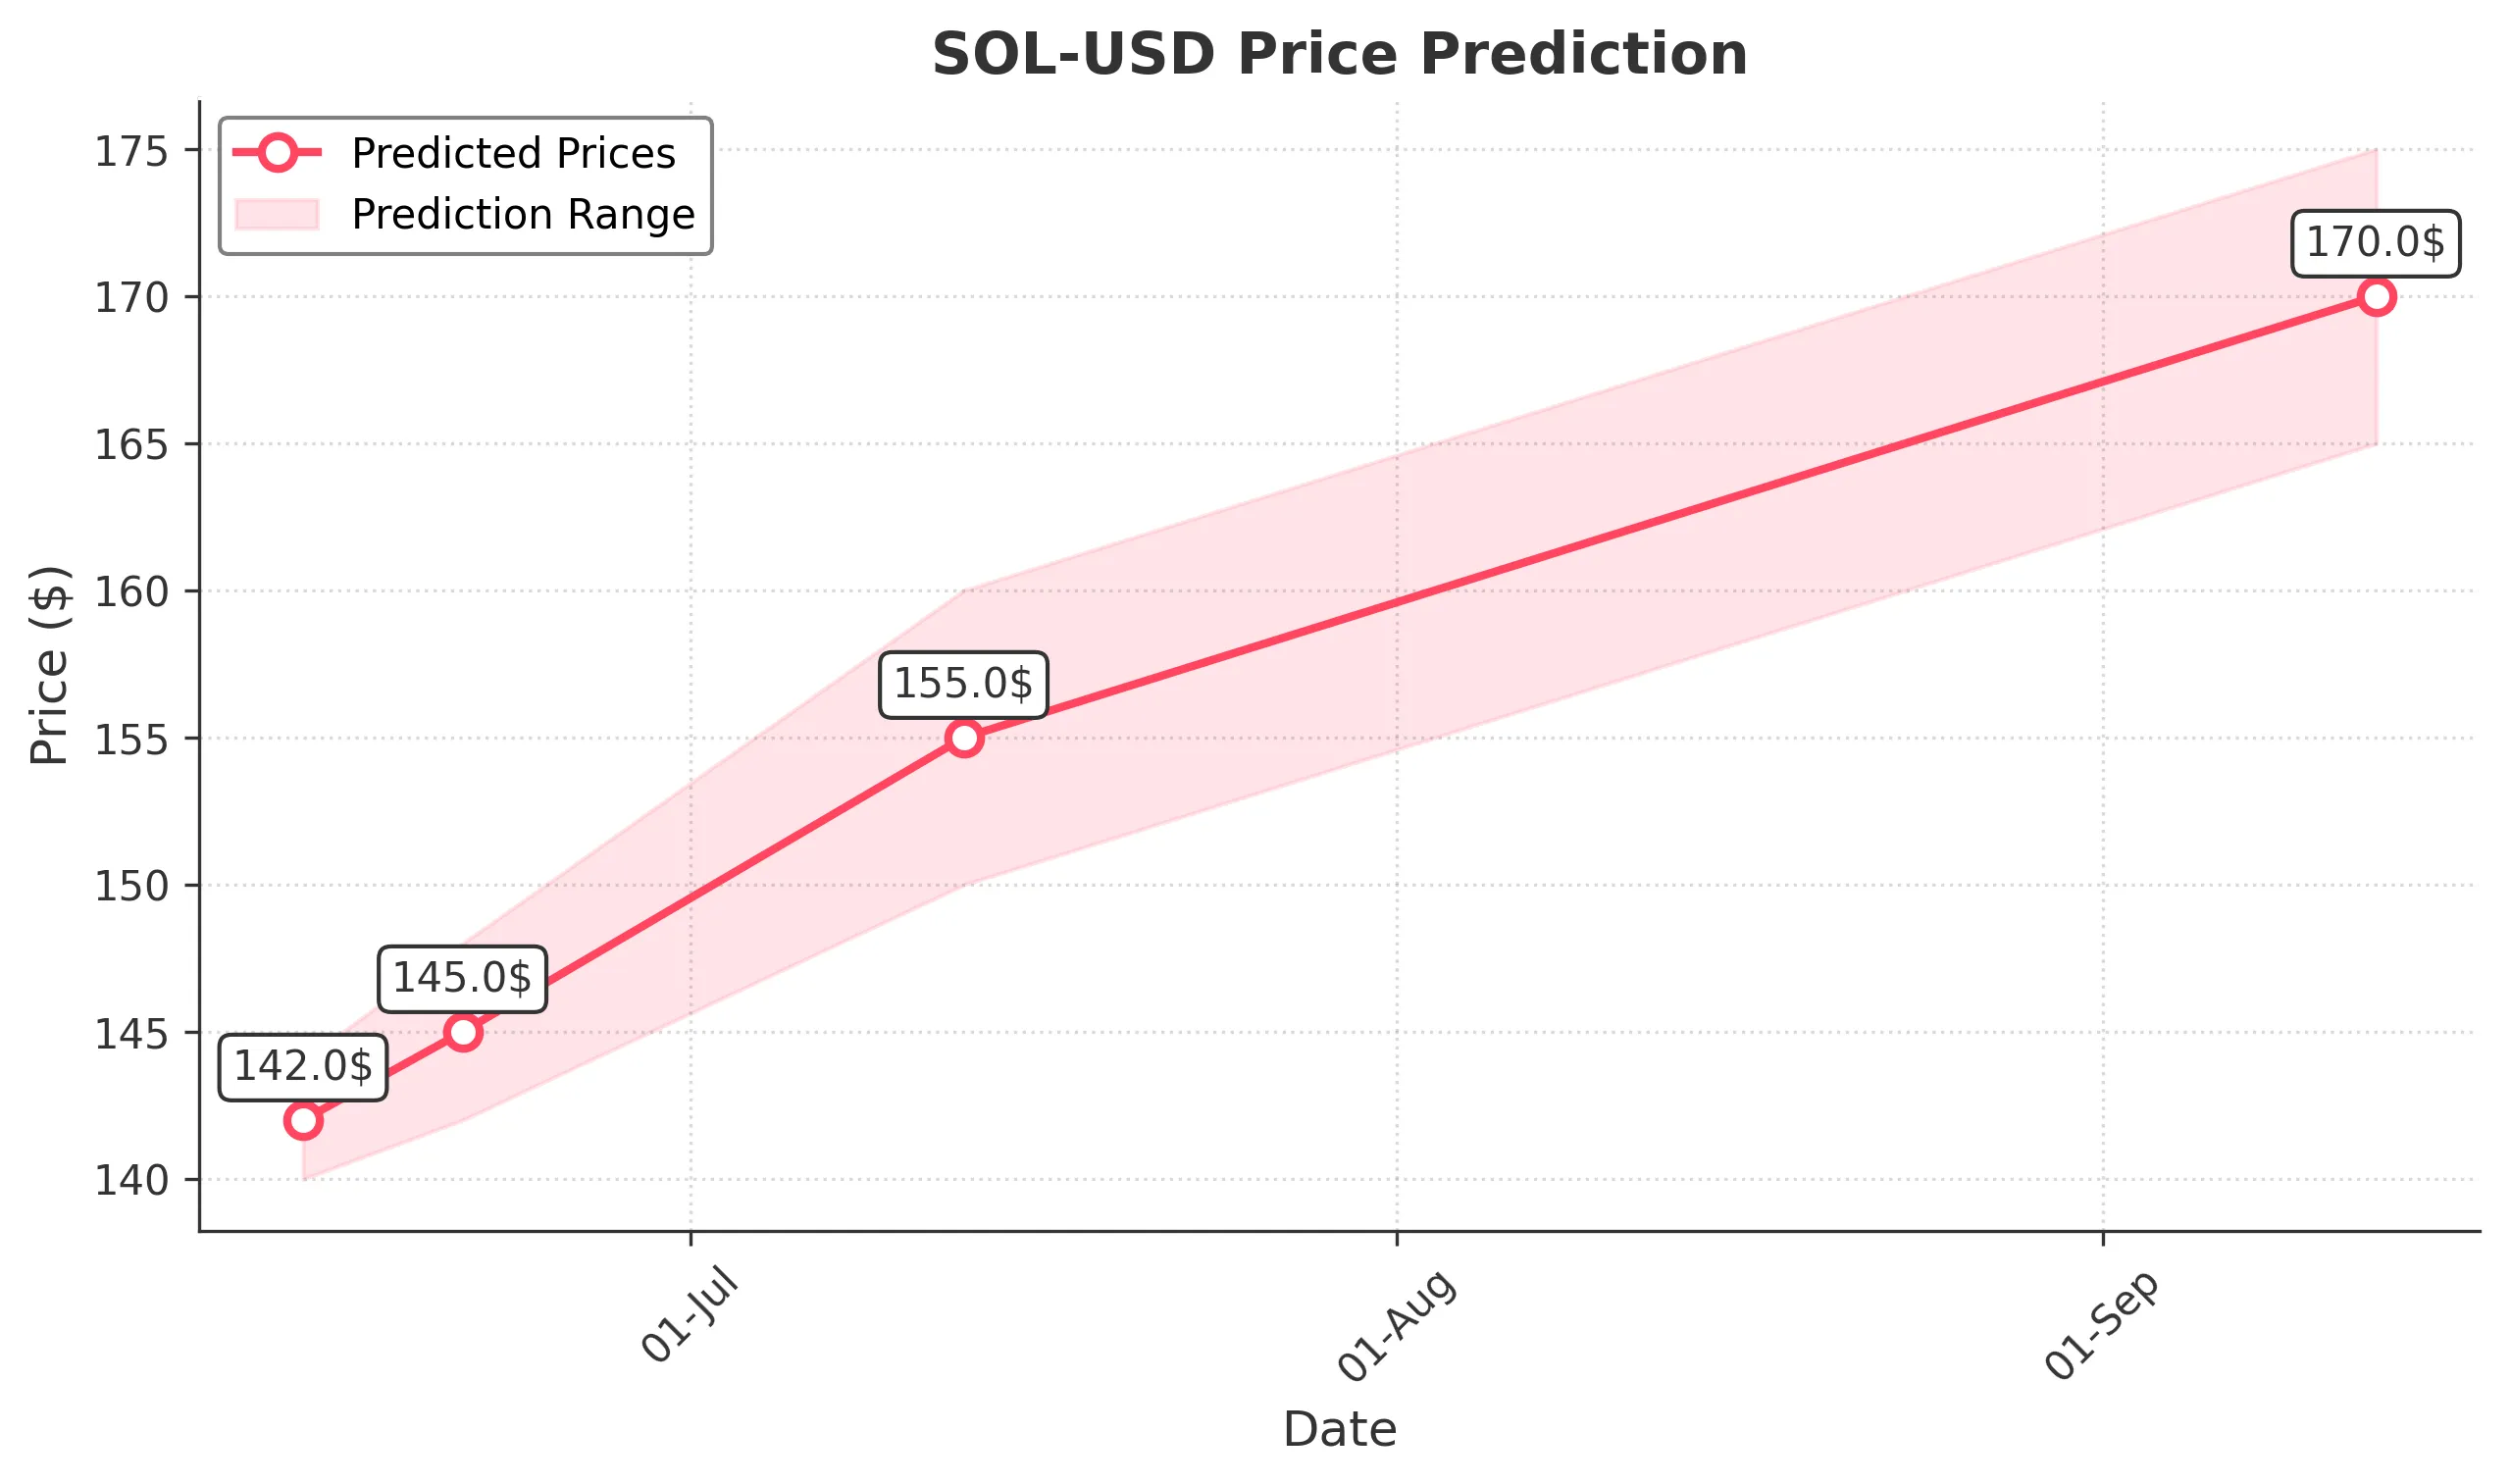
Target: June 14, 2025$142
$143
$144
$140
Description
The stock shows bearish momentum with a recent downtrend. RSI indicates oversold conditions, but MACD is bearish. Expect a slight recovery, but volatility remains high due to recent volume spikes.
Analysis
Over the past 3 months, SOL-USD has shown significant volatility, with a recent bearish trend. Key support at $140 and resistance at $160. Volume spikes indicate strong trading interest, but overall sentiment is cautious.
Confidence Level
Potential Risks
Market sentiment is uncertain, and any negative news could lead to further declines.
1 Week Prediction
Target: June 21, 2025$145
$143.5
$148
$142
Description
A potential rebound is expected as the stock approaches key support levels. RSI may recover from oversold, and MACD shows signs of convergence. However, external market factors could impact performance.
Analysis
The stock has been in a bearish phase, but recent price action suggests a possible reversal. Key support at $140 and resistance at $150. Volume analysis shows increased interest, indicating potential for upward movement.
Confidence Level
Potential Risks
Unforeseen macroeconomic events could disrupt the recovery, leading to further volatility.
1 Month Prediction
Target: July 13, 2025$155
$154
$160
$150
Description
If the bullish momentum continues, the stock could reach $155. Technical indicators suggest a recovery, but market sentiment remains mixed. Watch for resistance at $160.
Analysis
The stock has shown signs of recovery after a bearish trend. Key support at $140 and resistance at $160. Volume patterns indicate increased buying interest, but caution is advised due to potential market fluctuations.
Confidence Level
Potential Risks
Market volatility and external factors could hinder the expected recovery.
3 Months Prediction
Target: September 13, 2025$170
$168
$175
$165
Description
If the upward trend continues, the stock could reach $170. Positive market sentiment and technical indicators support this prediction, but external factors could impact performance.
Analysis
The stock has shown a recovery trend, with key support at $150 and resistance at $175. Technical indicators suggest bullish momentum, but external economic factors could introduce volatility.
Confidence Level
Potential Risks
Potential market corrections and economic changes could affect the stock's trajectory.