SOL-USD Trading Predictions
1 Day Prediction
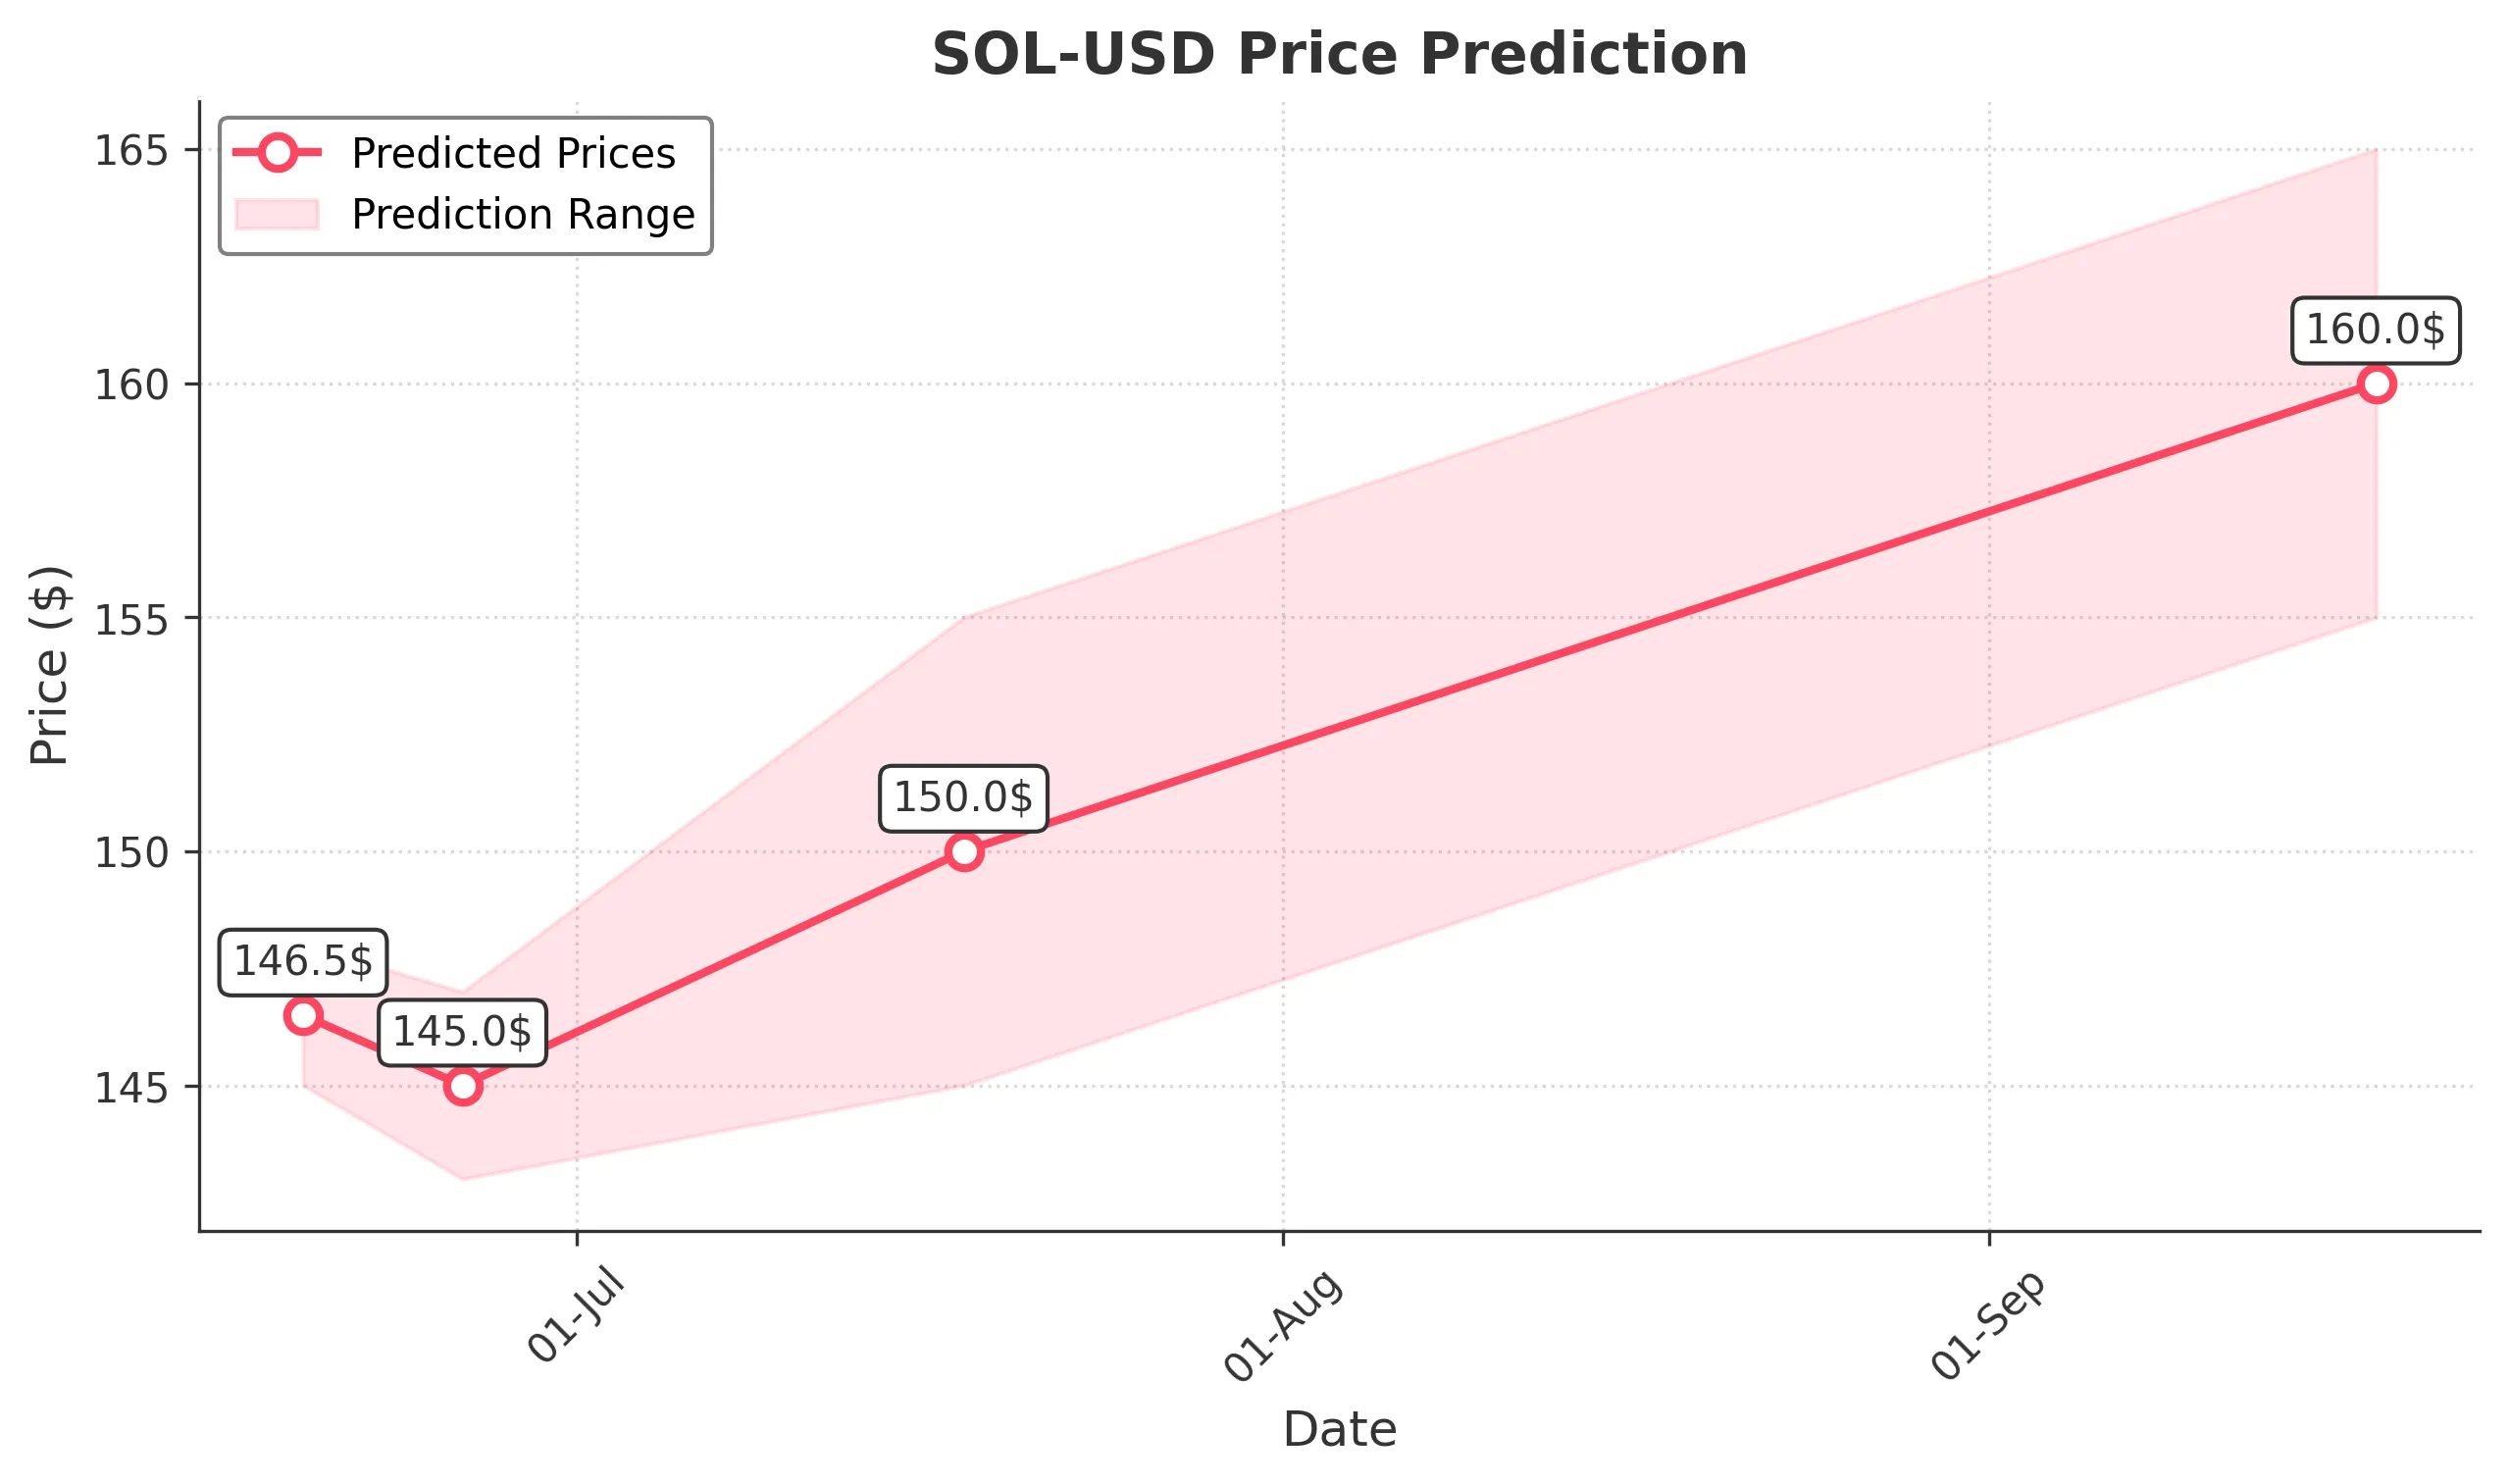
Target: June 19, 2025$146.5
$146
$148
$145
Description
The stock shows a slight bearish trend with recent lower highs and lower lows. RSI indicates oversold conditions, suggesting a potential bounce. However, MACD is bearish, and volume is declining, indicating caution.
Analysis
Over the past 3 months, SOL-USD has experienced significant volatility, with a recent bearish trend. Key support at $145 and resistance at $160. Volume spikes indicate strong interest, but recent declines suggest caution. Technical indicators show mixed signals.
Confidence Level
Potential Risks
Market volatility and external news could impact the prediction. A sudden bullish reversal is possible if sentiment shifts.
1 Week Prediction
Target: June 26, 2025$145
$145.5
$147
$143
Description
The bearish trend may continue, with potential support at $143. RSI remains low, indicating oversold conditions. However, MACD shows a potential bullish crossover, suggesting a possible reversal in the near term.
Analysis
The stock has been in a downtrend, with significant resistance at $150. Volume analysis shows declining interest, and technical indicators suggest a potential reversal but with risks of further declines.
Confidence Level
Potential Risks
Unforeseen market events or news could lead to volatility. The bearish trend may persist if selling pressure continues.
1 Month Prediction
Target: July 18, 2025$150
$148
$155
$145
Description
A potential recovery is anticipated as the stock approaches key support levels. RSI may recover from oversold conditions, and MACD could indicate a bullish trend. However, caution is advised due to recent volatility.
Analysis
The stock has shown significant fluctuations, with a recent bearish trend. Key support at $145 and resistance at $155. Technical indicators suggest a potential recovery, but market sentiment remains cautious.
Confidence Level
Potential Risks
Market sentiment and external factors could influence the recovery. A failure to break resistance at $155 may lead to further declines.
3 Months Prediction
Target: September 18, 2025$160
$158
$165
$155
Description
If the bullish reversal materializes, the stock could reach $160. Positive market sentiment and improved technical indicators may support this. However, external factors could still pose risks.
Analysis
The stock has shown a volatile pattern with a recent bearish trend. Key resistance at $165 and support at $155. Technical indicators suggest a potential recovery, but market sentiment remains mixed, indicating risks of further declines.
Confidence Level
Potential Risks
Potential market corrections or negative news could derail the bullish outlook. The stock's performance is highly dependent on broader market conditions.