SOL-USD Trading Predictions
1 Day Prediction
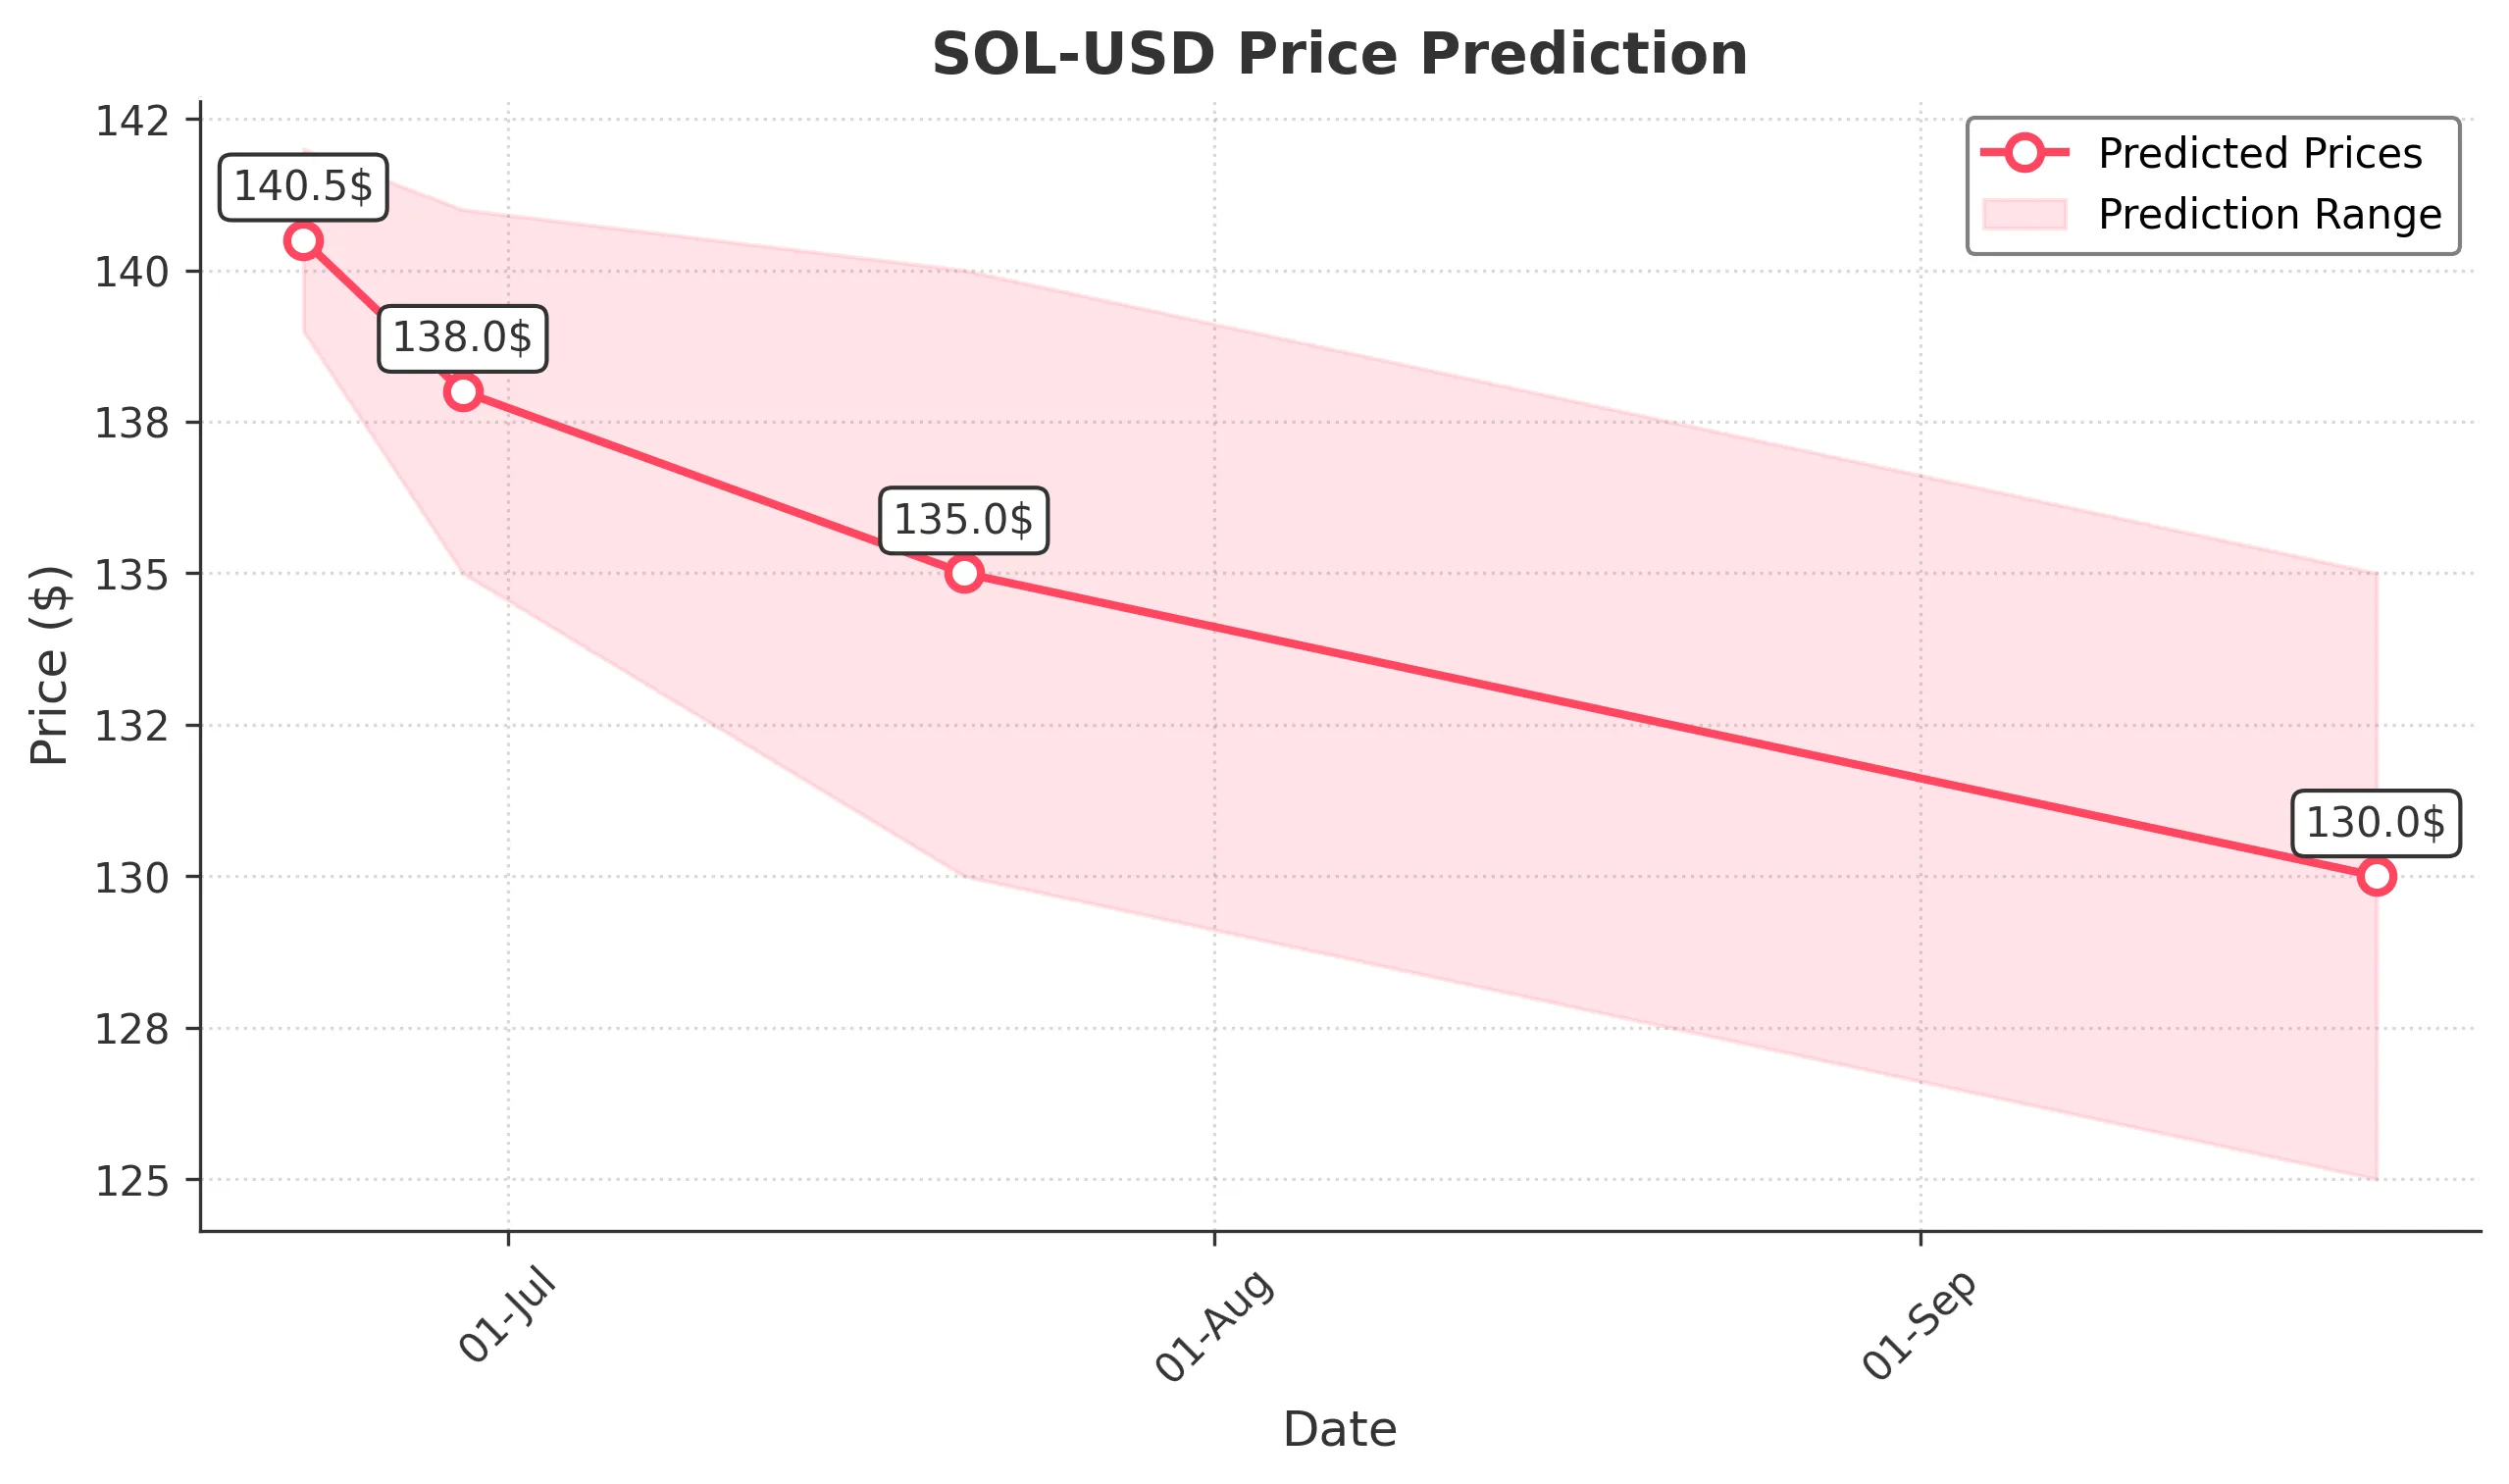
Target: June 22, 2025$140.5
$140.2
$142
$139
Description
The stock shows signs of consolidation around the 140 level, with recent bearish momentum. RSI indicates oversold conditions, suggesting a potential bounce. However, MACD is bearish, indicating caution. Volume remains high, reflecting market interest.
Analysis
Over the past 3 months, SOL-USD has experienced significant volatility, with a recent bearish trend after reaching highs above 180. Key support at 140 has held, but bearish signals from MACD and RSI suggest potential further declines. Volume spikes indicate strong trading interest, but uncertainty remains.
Confidence Level
Potential Risks
Market volatility and external news could impact the price significantly.
1 Week Prediction
Target: June 29, 2025$138
$139
$141
$135
Description
The bearish trend may continue as the stock struggles to maintain above 140. Technical indicators suggest further downside potential. A break below 135 could trigger more selling pressure. Volume analysis shows increased selling activity.
Analysis
The stock has shown a bearish trend with significant resistance at 150. Recent price action indicates a struggle to maintain upward momentum. Key support at 135 is critical; a breach could lead to further declines. Volume patterns suggest increased selling pressure.
Confidence Level
Potential Risks
Unexpected market news or macroeconomic events could alter this trajectory.
1 Month Prediction
Target: July 21, 2025$135
$138
$140
$130
Description
Continued bearish sentiment may push the price down to 135. Technical indicators show weakness, with MACD and RSI suggesting further declines. A potential bounce could occur if support at 130 holds, but overall sentiment remains negative.
Analysis
The stock has been in a bearish phase, with significant resistance at 150 and support at 130. Recent price action indicates a lack of buying interest. Technical indicators suggest further downside potential, but a bounce could occur if support levels hold.
Confidence Level
Potential Risks
Market sentiment can shift rapidly, and external factors may influence price movements.
3 Months Prediction
Target: September 21, 2025$130
$132
$135
$125
Description
If the bearish trend continues, the price may settle around 130. Key support levels will be tested, and a break below could lead to further declines. Market sentiment remains cautious, and external factors could impact trading volumes.
Analysis
The stock has faced significant downward pressure, with key resistance at 150 and support at 130. The overall trend is bearish, and technical indicators suggest further declines. Volume patterns indicate a lack of buying interest, and macroeconomic factors could further influence price movements.
Confidence Level
Potential Risks
Long-term predictions are uncertain due to potential market shifts and external influences.