SOL-USD Trading Predictions
1 Day Prediction
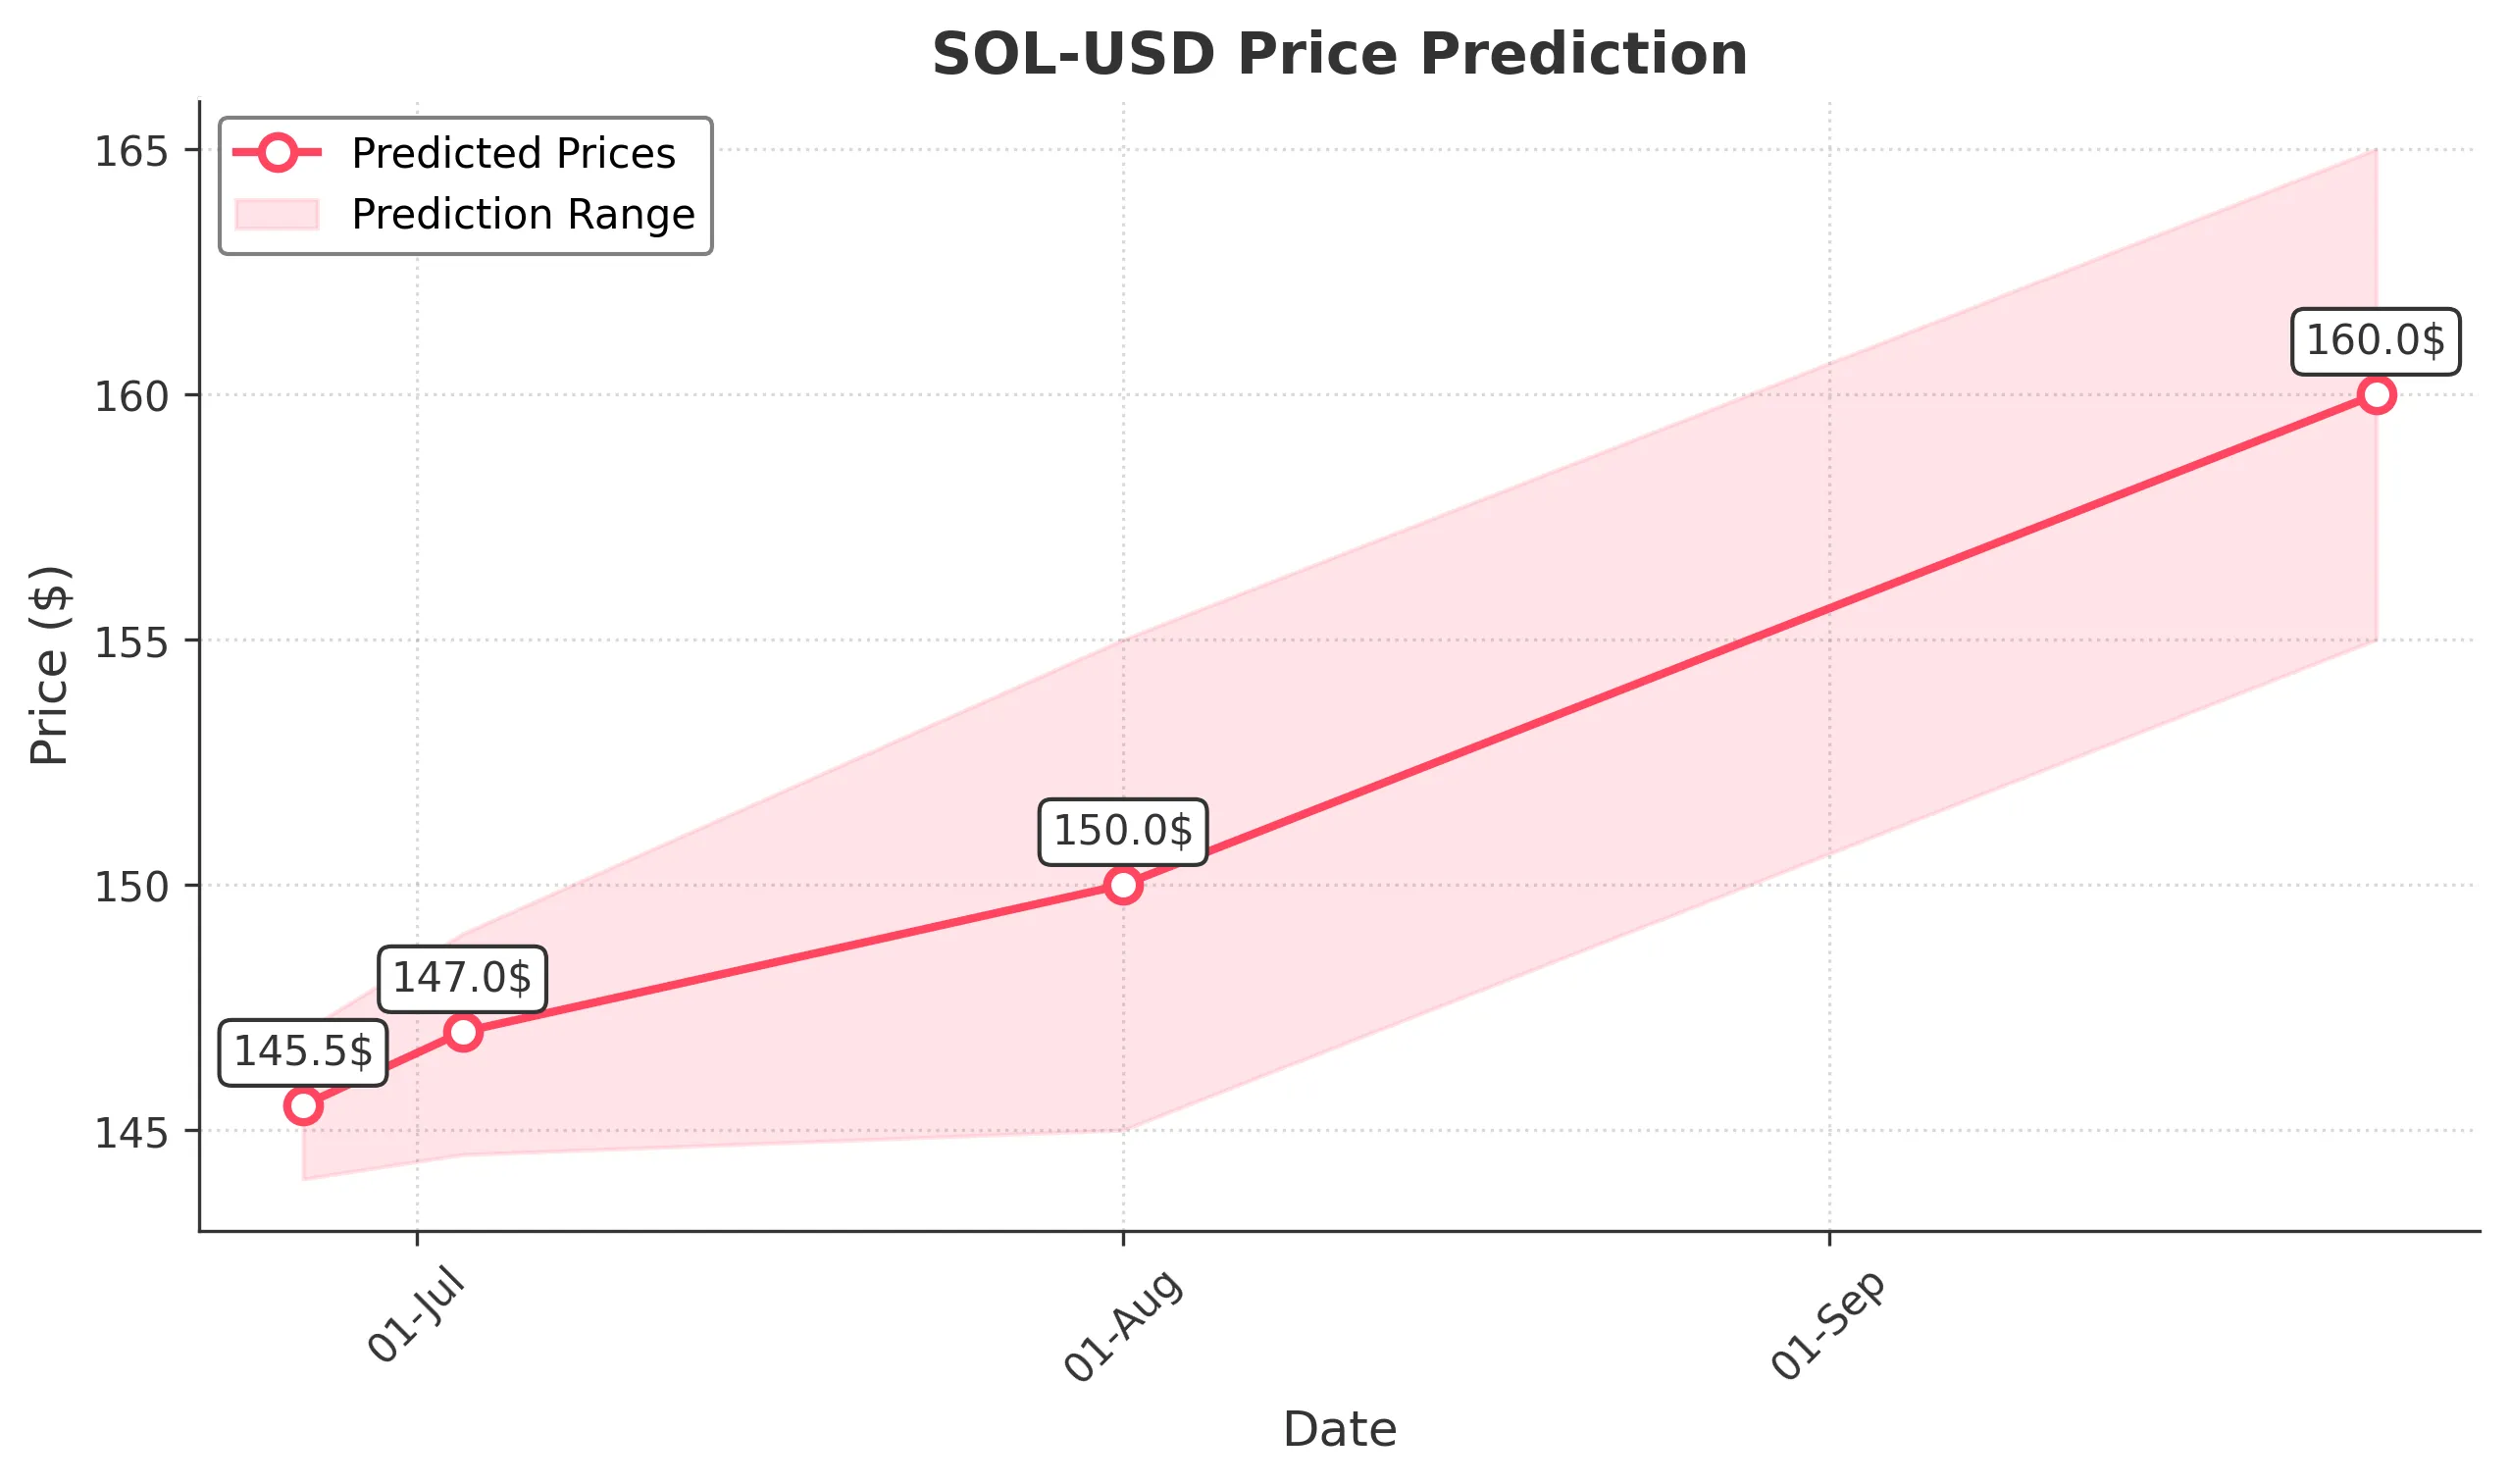
Target: June 26, 2025$145.5
$145
$147
$144
Description
The stock shows a slight bullish trend with a potential close around 145.5. The recent candlestick patterns indicate indecision, but the RSI is neutral, suggesting a possible bounce. Volume remains steady, indicating sustained interest.
Analysis
Over the past 3 months, SOL-USD has shown a bearish trend with significant fluctuations. Key support is around 140, while resistance is near 150. The RSI indicates neutral momentum, and recent volume spikes suggest increased trading activity.
Confidence Level
Potential Risks
Market volatility and external news could impact the price significantly.
1 Week Prediction
Target: July 3, 2025$147
$145.5
$149
$144.5
Description
Expect a slight recovery to 147.0 as the stock may find support at recent lows. The MACD shows a potential bullish crossover, and the Bollinger Bands indicate a tightening range, suggesting a breakout could occur.
Analysis
The stock has been in a bearish phase but shows signs of stabilization. Key resistance at 150 and support at 140 are critical. The ATR indicates moderate volatility, and the market sentiment remains cautious.
Confidence Level
Potential Risks
Unforeseen macroeconomic events could lead to volatility.
1 Month Prediction
Target: August 1, 2025$150
$147
$155
$145
Description
A gradual rise to 150.0 is anticipated as bullish momentum builds. The Fibonacci retracement levels suggest a potential reversal, and the RSI may trend upwards, indicating increasing buying pressure.
Analysis
The stock has shown recovery signs after a bearish trend. Key support at 140 and resistance at 155 are pivotal. The MACD indicates potential bullish momentum, while volume patterns suggest renewed interest.
Confidence Level
Potential Risks
Market sentiment could shift due to external factors, impacting the forecast.
3 Months Prediction
Target: September 25, 2025$160
$158
$165
$155
Description
A bullish outlook to 160.0 is expected as the stock may break through resistance levels. The MACD and RSI indicate strong upward momentum, and the market sentiment appears to be shifting positively.
Analysis
The stock has transitioned from bearish to a more bullish sentiment. Key resistance at 165 and support at 150 are crucial. The ATR suggests increasing volatility, and recent volume spikes indicate heightened trading activity.
Confidence Level
Potential Risks
Potential market corrections or negative news could alter this trajectory.