SOL-USD Trading Predictions
1 Day Prediction
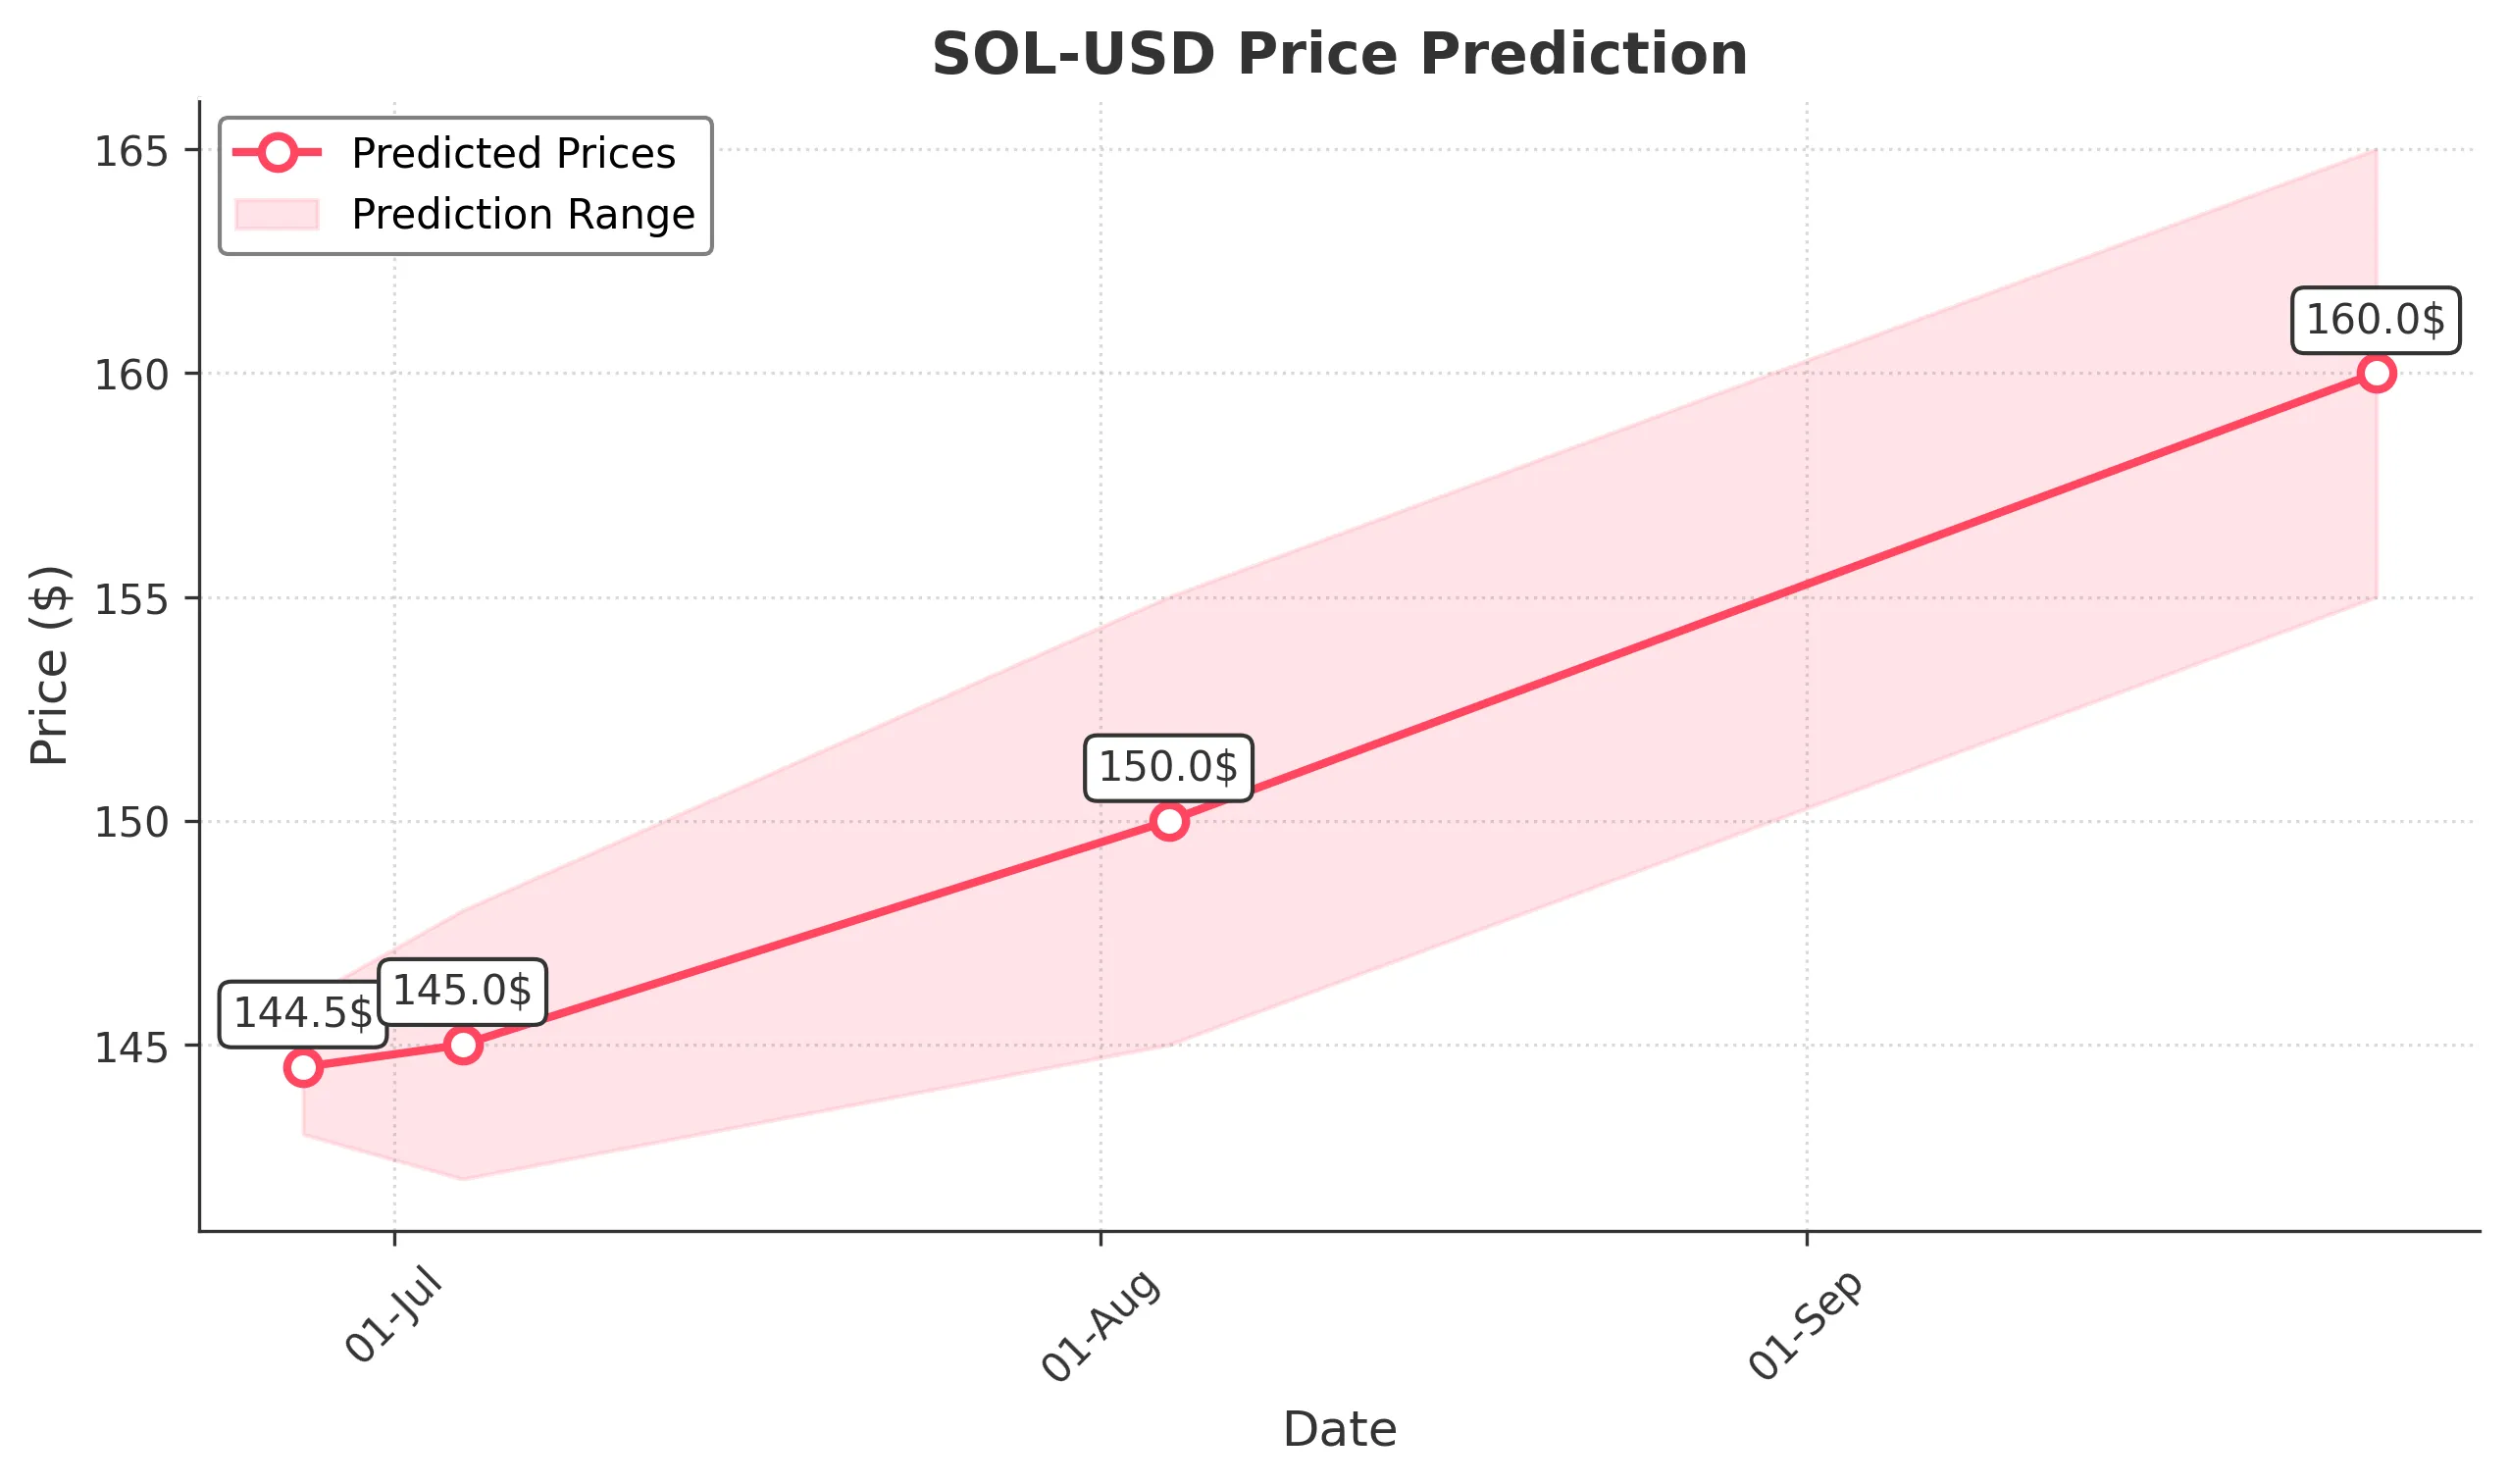
Target: June 27, 2025$144.5
$144
$146
$143
Description
The stock shows a slight bullish trend with a recent Doji pattern indicating indecision. RSI is neutral, and MACD is close to crossing above the signal line. Expecting a minor rebound after recent declines.
Analysis
Over the past 3 months, SOL-USD has shown significant volatility with a bearish trend recently. Key support at 140.0 and resistance at 150.0. Volume spikes indicate strong interest, but recent declines raise concerns.
Confidence Level
Potential Risks
Market volatility and external news could impact the price unexpectedly.
1 Week Prediction
Target: July 4, 2025$145
$144.5
$148
$142
Description
Expecting a slight recovery as the stock approaches key support levels. The MACD shows potential bullish divergence, and the RSI is recovering from oversold conditions. However, caution is advised due to market sentiment.
Analysis
The stock has been in a bearish phase with significant fluctuations. Recent volume spikes suggest accumulation, but the overall trend remains uncertain. Key support at 140.0 and resistance at 150.0.
Confidence Level
Potential Risks
Potential for further declines if market sentiment shifts negatively or if macroeconomic factors worsen.
1 Month Prediction
Target: August 4, 2025$150
$146
$155
$145
Description
Anticipating a gradual recovery as bullish signals emerge from technical indicators. The stock may test resistance at 150.0, supported by improving market sentiment and potential positive news.
Analysis
The stock has shown a mix of bullish and bearish signals. Recent price action indicates potential for recovery, but overall market conditions remain volatile. Key levels to watch are 140.0 (support) and 150.0 (resistance).
Confidence Level
Potential Risks
Unforeseen market events or negative news could derail the recovery.
3 Months Prediction
Target: September 26, 2025$160
$158
$165
$155
Description
Expecting a bullish trend as the stock stabilizes and market sentiment improves. Technical indicators suggest a potential breakout above resistance levels, supported by positive macroeconomic developments.
Analysis
The stock has experienced significant fluctuations, with a recent bearish trend. However, signs of recovery are emerging, and if the bullish momentum continues, it could break through key resistance levels. Watch for macroeconomic influences.
Confidence Level
Potential Risks
Long-term predictions are subject to market volatility and external economic factors.