SOL-USD Trading Predictions
1 Day Prediction
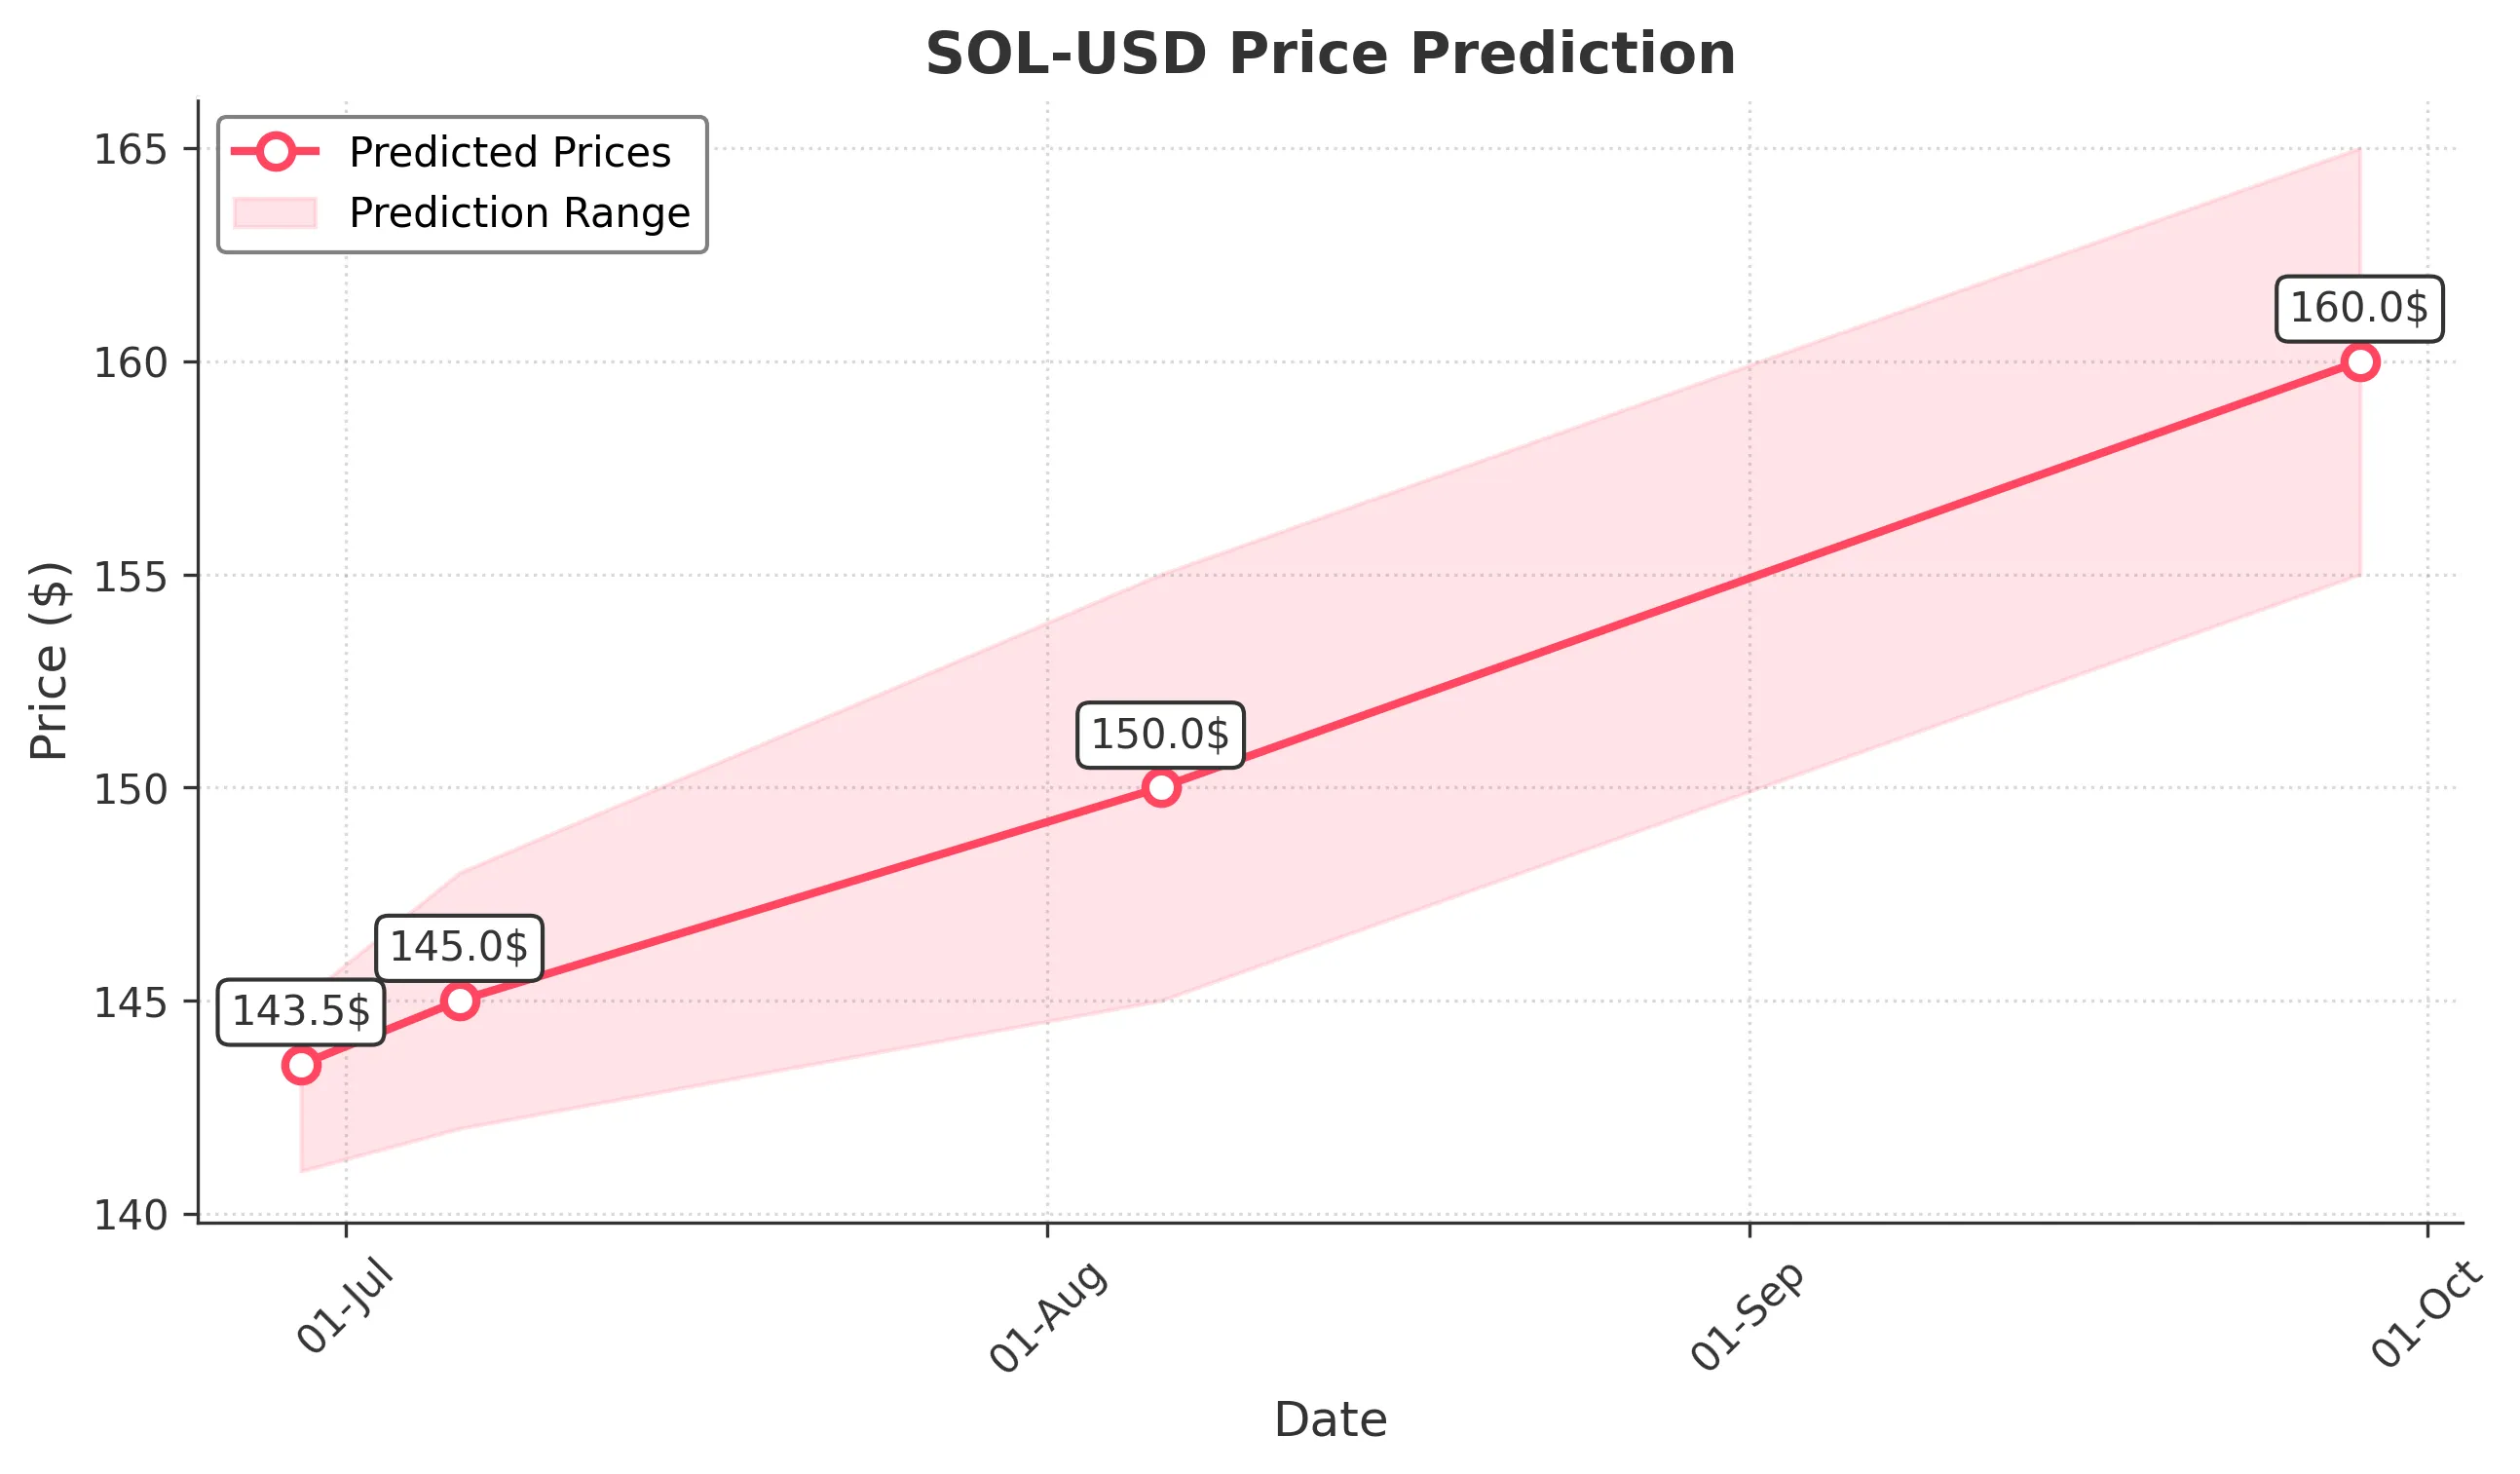
Target: June 29, 2025$143.5
$144
$145
$141
Description
The stock shows a slight bearish trend with recent lower highs and lower lows. RSI indicates oversold conditions, suggesting a potential bounce. However, MACD is bearish, and volume has been declining, indicating caution.
Analysis
Over the past 3 months, SOL-USD has experienced significant volatility, with a recent bearish trend. Key support is around 140, while resistance is near 150. Volume spikes indicate strong interest, but the overall trend remains uncertain.
Confidence Level
Potential Risks
Market volatility and external news could impact the prediction. A sudden bullish reversal is possible if buying pressure increases.
1 Week Prediction
Target: July 6, 2025$145
$143.5
$148
$142
Description
A potential recovery is indicated as the stock approaches key support levels. The RSI is improving, suggesting a reversal may occur. However, MACD remains bearish, and caution is advised as market sentiment is mixed.
Analysis
The stock has shown a bearish trend recently, with significant fluctuations. Support at 140 is critical, while resistance at 150 remains a challenge. Volume analysis shows spikes during sell-offs, indicating strong selling pressure.
Confidence Level
Potential Risks
Unforeseen macroeconomic events or negative news could hinder recovery. The bearish MACD signal raises concerns about sustainability.
1 Month Prediction
Target: August 6, 2025$150
$145.5
$155
$145
Description
If the stock maintains upward momentum, it could reach 150. The RSI is recovering, and a bullish divergence is forming. However, the overall market sentiment remains cautious, and external factors could impact performance.
Analysis
The stock has been volatile, with a recent bearish trend. Key support at 140 and resistance at 150 are critical levels. Volume patterns indicate strong selling pressure, but potential recovery signals are emerging.
Confidence Level
Potential Risks
Market volatility and potential bearish news could reverse the trend. The current bullish signals may not hold if selling pressure resumes.
3 Months Prediction
Target: September 28, 2025$160
$158
$165
$155
Description
If the bullish trend continues, the stock could reach 160. Positive market sentiment and improved RSI suggest potential recovery. However, macroeconomic factors and market volatility could pose risks.
Analysis
The stock has shown significant volatility, with a recent bearish trend. Key support at 140 and resistance at 150 are critical. Volume analysis indicates strong selling pressure, but potential recovery signals are emerging.
Confidence Level
Potential Risks
Unforeseen market events or negative news could derail the bullish outlook. The current trend is fragile and could reverse quickly.