SOL-USD Trading Predictions
1 Day Prediction
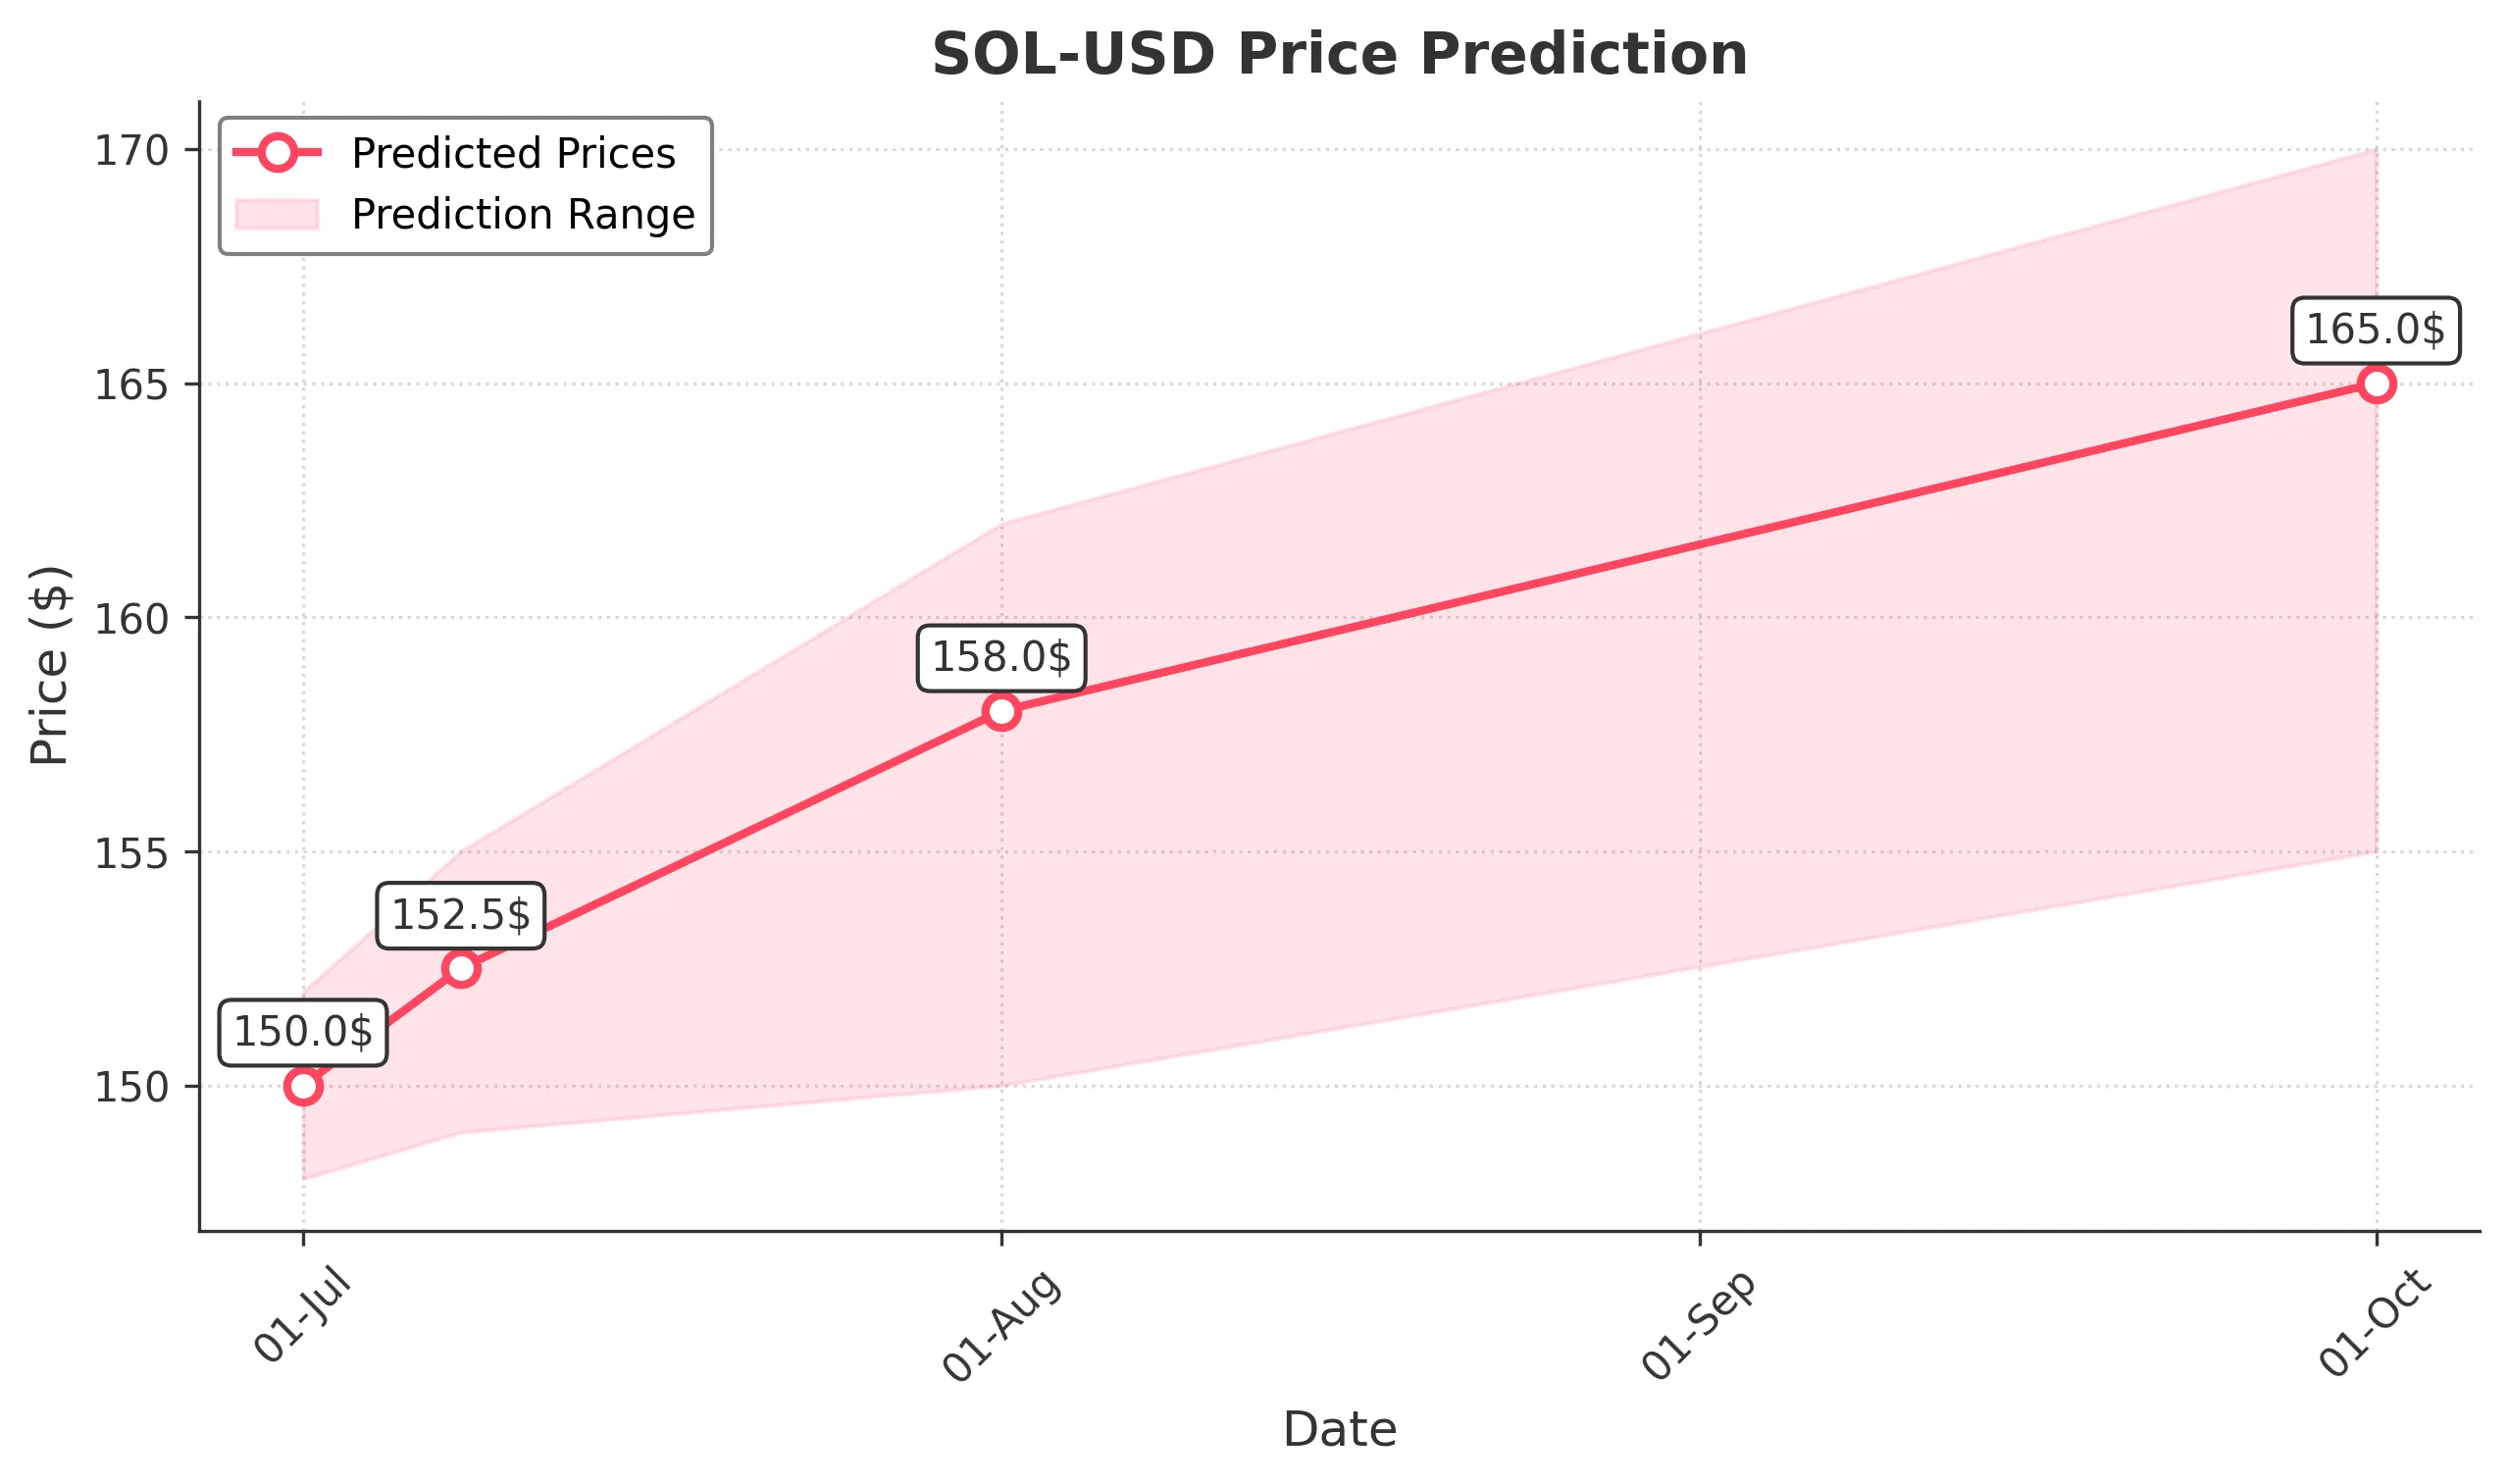
Target: July 1, 2025$150
$150.5
$152
$148
Description
The stock shows a slight bullish trend with a potential close around 150.0. The recent candlestick patterns indicate indecision, while the RSI is neutral. Volume remains steady, suggesting consolidation before a potential breakout.
Analysis
Over the past 3 months, SOL-USD has shown a bearish trend with significant fluctuations. Key support is around 140, while resistance is near 160. The RSI indicates potential oversold conditions, but recent volume spikes suggest uncertainty.
Confidence Level
Potential Risks
Market volatility and external news could impact the price significantly.
1 Week Prediction
Target: July 8, 2025$152.5
$150
$155
$149
Description
Expect a gradual increase to 152.5 as bullish momentum builds. The MACD shows a potential crossover, indicating a shift in momentum. However, resistance at 155 may limit gains.
Analysis
The stock has been volatile, with recent highs around 160 and lows near 140. The Bollinger Bands suggest a tightening range, indicating a possible breakout. Volume analysis shows increased interest, but caution is warranted.
Confidence Level
Potential Risks
Potential market corrections or negative news could reverse this trend.
1 Month Prediction
Target: August 1, 2025$158
$155
$162
$150
Description
A bullish outlook with a target close of 158.0, supported by a potential breakout above resistance levels. The Fibonacci retracement levels suggest a retracement to 61.8% could provide support.
Analysis
The stock has shown a recovery from recent lows, with key resistance at 160. The RSI indicates a bullish divergence, while volume trends suggest increasing investor interest. However, external factors could introduce volatility.
Confidence Level
Potential Risks
Market sentiment and macroeconomic factors could influence this prediction.
3 Months Prediction
Target: October 1, 2025$165
$160
$170
$155
Description
Long-term bullish trend expected, with a close around 165.0. The MACD indicates sustained upward momentum, and the stock may test higher resistance levels. However, market corrections could occur.
Analysis
The overall trend has been bullish, with significant support at 150 and resistance at 170. The ATR indicates increasing volatility, and recent volume spikes suggest strong interest. A balanced view is necessary as market conditions evolve.
Confidence Level
Potential Risks
Unforeseen macroeconomic events or regulatory changes could impact the stock's performance.