SOL-USD Trading Predictions
1 Day Prediction
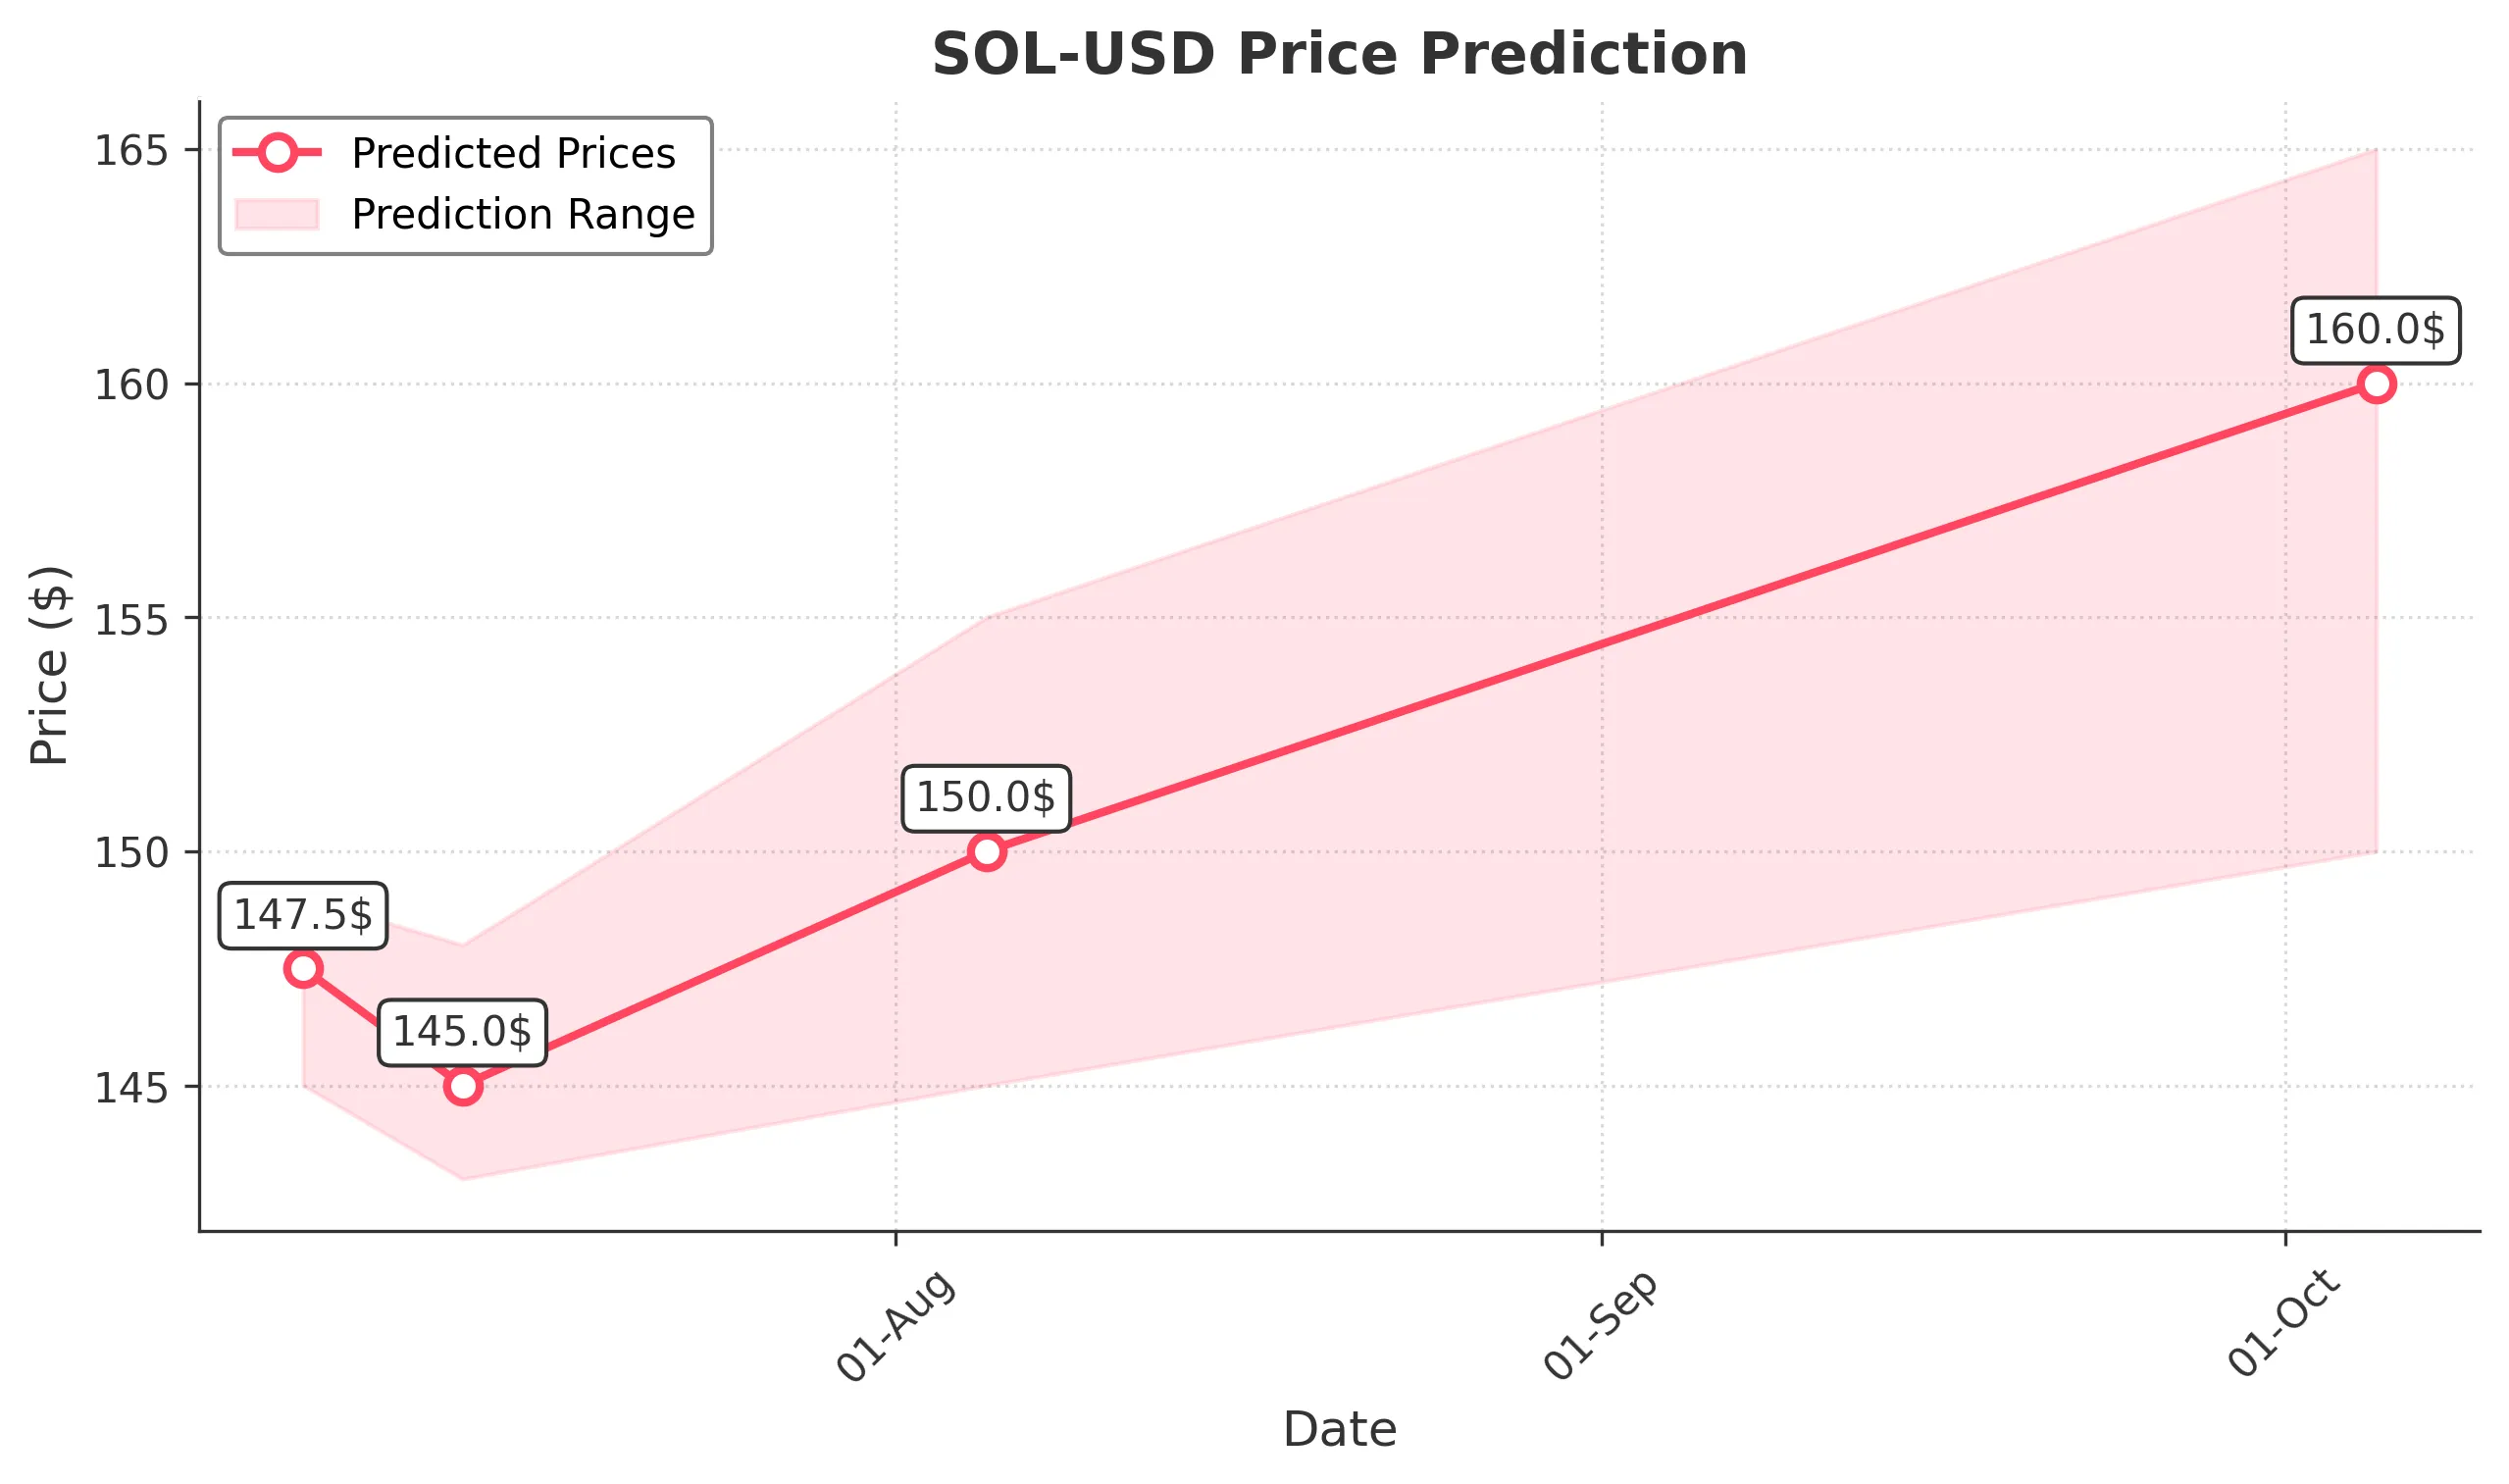
Target: July 6, 2025$147.5
$147.8
$149
$145
Description
The stock shows a slight bearish trend with recent lower highs and lower lows. RSI indicates oversold conditions, suggesting a potential bounce. However, MACD is bearish, indicating continued downward pressure. Volume remains moderate, reflecting cautious sentiment.
Analysis
Over the past 3 months, SOL-USD has experienced significant volatility, with a recent bearish trend. Key support is around $145, while resistance is near $155. Technical indicators show mixed signals, with RSI suggesting oversold conditions but MACD indicating bearish momentum. Volume spikes on down days suggest selling pressure.
Confidence Level
Potential Risks
Market volatility and external news could impact the prediction. A sudden bullish reversal is possible if buying pressure increases.
1 Week Prediction
Target: July 13, 2025$145
$146
$148
$143
Description
The bearish trend may continue into next week, with potential support at $143. The recent candlestick patterns indicate indecision, but overall momentum remains negative. Volume analysis shows selling pressure, which could keep prices subdued.
Analysis
The stock has been in a bearish phase, with significant fluctuations. Support at $143 is critical, while resistance is at $155. Technical indicators show bearish momentum, and volume patterns suggest selling pressure. Market sentiment remains cautious.
Confidence Level
Potential Risks
Unforeseen market events or news could lead to sudden price changes. A bullish reversal is possible if buying interest increases significantly.
1 Month Prediction
Target: August 5, 2025$150
$148
$155
$145
Description
A potential recovery could occur in the next month as the stock approaches key support levels. RSI may indicate a reversal, and if buying pressure increases, we could see a rally towards $155. However, caution is advised due to ongoing volatility.
Analysis
The stock has shown significant volatility, with a recent bearish trend. Key support at $145 and resistance at $155 are critical levels. Technical indicators suggest potential for a rebound, but overall market sentiment remains cautious.
Confidence Level
Potential Risks
Market conditions are unpredictable, and external factors could hinder recovery. A bearish trend could persist if selling pressure continues.
3 Months Prediction
Target: October 5, 2025$160
$155
$165
$150
Description
If the stock can stabilize above $150, a bullish trend may develop over the next three months. Positive market sentiment and potential macroeconomic improvements could drive prices higher. However, caution is warranted due to potential volatility.
Analysis
The stock has experienced significant fluctuations, with a recent bearish trend. Key support at $145 and resistance at $155 are critical. Technical indicators suggest potential for recovery, but overall market sentiment remains cautious, with external factors influencing price movements.
Confidence Level
Potential Risks
Macroeconomic factors and market sentiment could change rapidly, impacting the prediction. A bearish reversal remains a possibility if selling pressure resumes.