SOL-USD Trading Predictions
1 Day Prediction
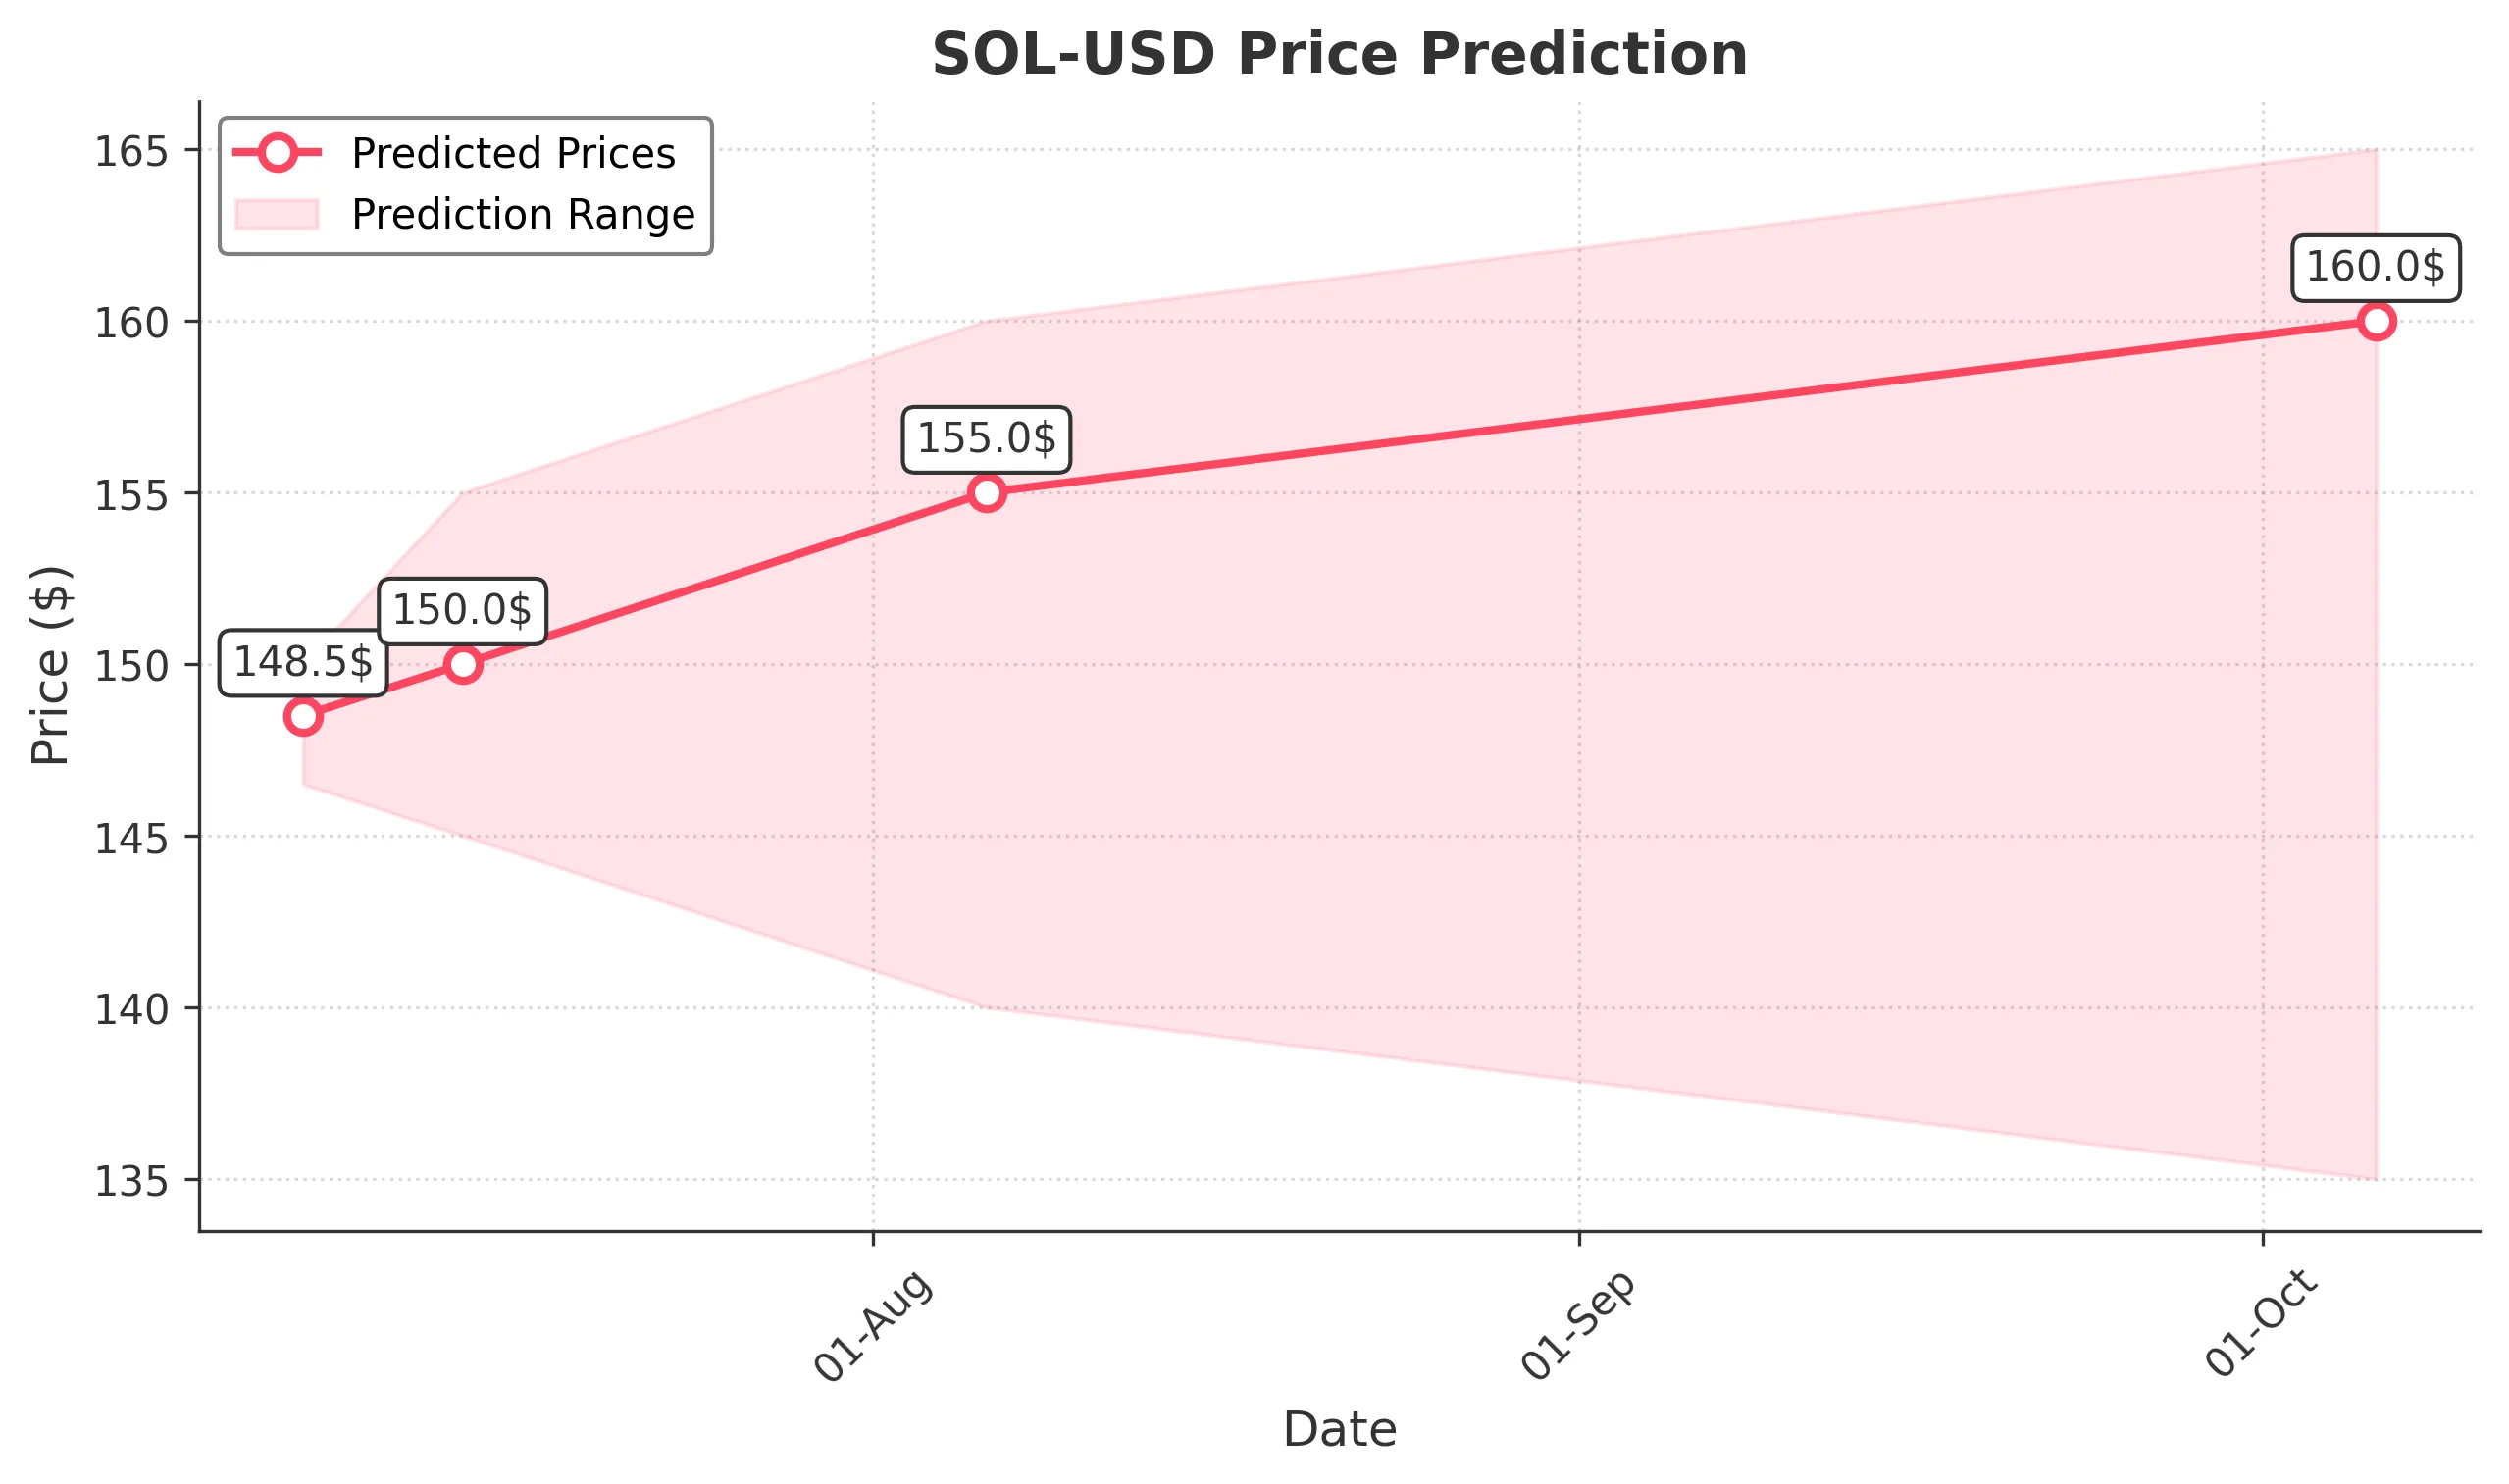
Target: July 7, 2025$148.5
$147.9
$150
$146.5
Description
The stock shows a slight bullish trend with a potential close around 148.50. The RSI is neutral, and MACD indicates a potential upward momentum. However, recent volatility suggests caution.
Analysis
Over the past 3 months, SOL-USD has shown significant volatility with a recent bearish trend. Key support at 145.00 and resistance at 155.00. Volume spikes indicate strong interest, but the overall trend is uncertain.
Confidence Level
Potential Risks
Market sentiment could shift quickly, and external news may impact price movements.
1 Week Prediction
Target: July 14, 2025$150
$148.5
$155
$145
Description
Expecting a close around 150.00 as the stock may recover slightly. The MACD shows a bullish crossover, but the RSI is approaching overbought territory, indicating potential pullbacks.
Analysis
The stock has been fluctuating with a recent bearish trend. Support at 145.00 is critical, while resistance at 155.00 may limit upward movement. Volume analysis shows increased trading activity, indicating investor interest.
Confidence Level
Potential Risks
Market volatility and external factors could lead to unexpected price movements.
1 Month Prediction
Target: August 6, 2025$155
$150
$160
$140
Description
A potential close of 155.00 suggests a recovery trend. The Bollinger Bands indicate a tightening range, which may lead to a breakout. However, the RSI indicates overbought conditions.
Analysis
The stock has shown a mix of bullish and bearish signals. Key support at 140.00 and resistance at 160.00. Recent volume spikes suggest strong interest, but the overall trend remains uncertain.
Confidence Level
Potential Risks
Market sentiment can shift rapidly, and external economic factors may influence price.
3 Months Prediction
Target: October 6, 2025$160
$155
$165
$135
Description
Expecting a close around 160.00 as the stock may stabilize. The MACD indicates potential bullish momentum, but the RSI suggests caution as it approaches overbought levels.
Analysis
The stock has experienced significant fluctuations. Key support at 135.00 and resistance at 165.00. The overall trend is mixed, with both bullish and bearish signals present. External factors could heavily influence future performance.
Confidence Level
Potential Risks
Long-term predictions are uncertain due to potential market shifts and economic changes.