SOL-USD Trading Predictions
1 Day Prediction
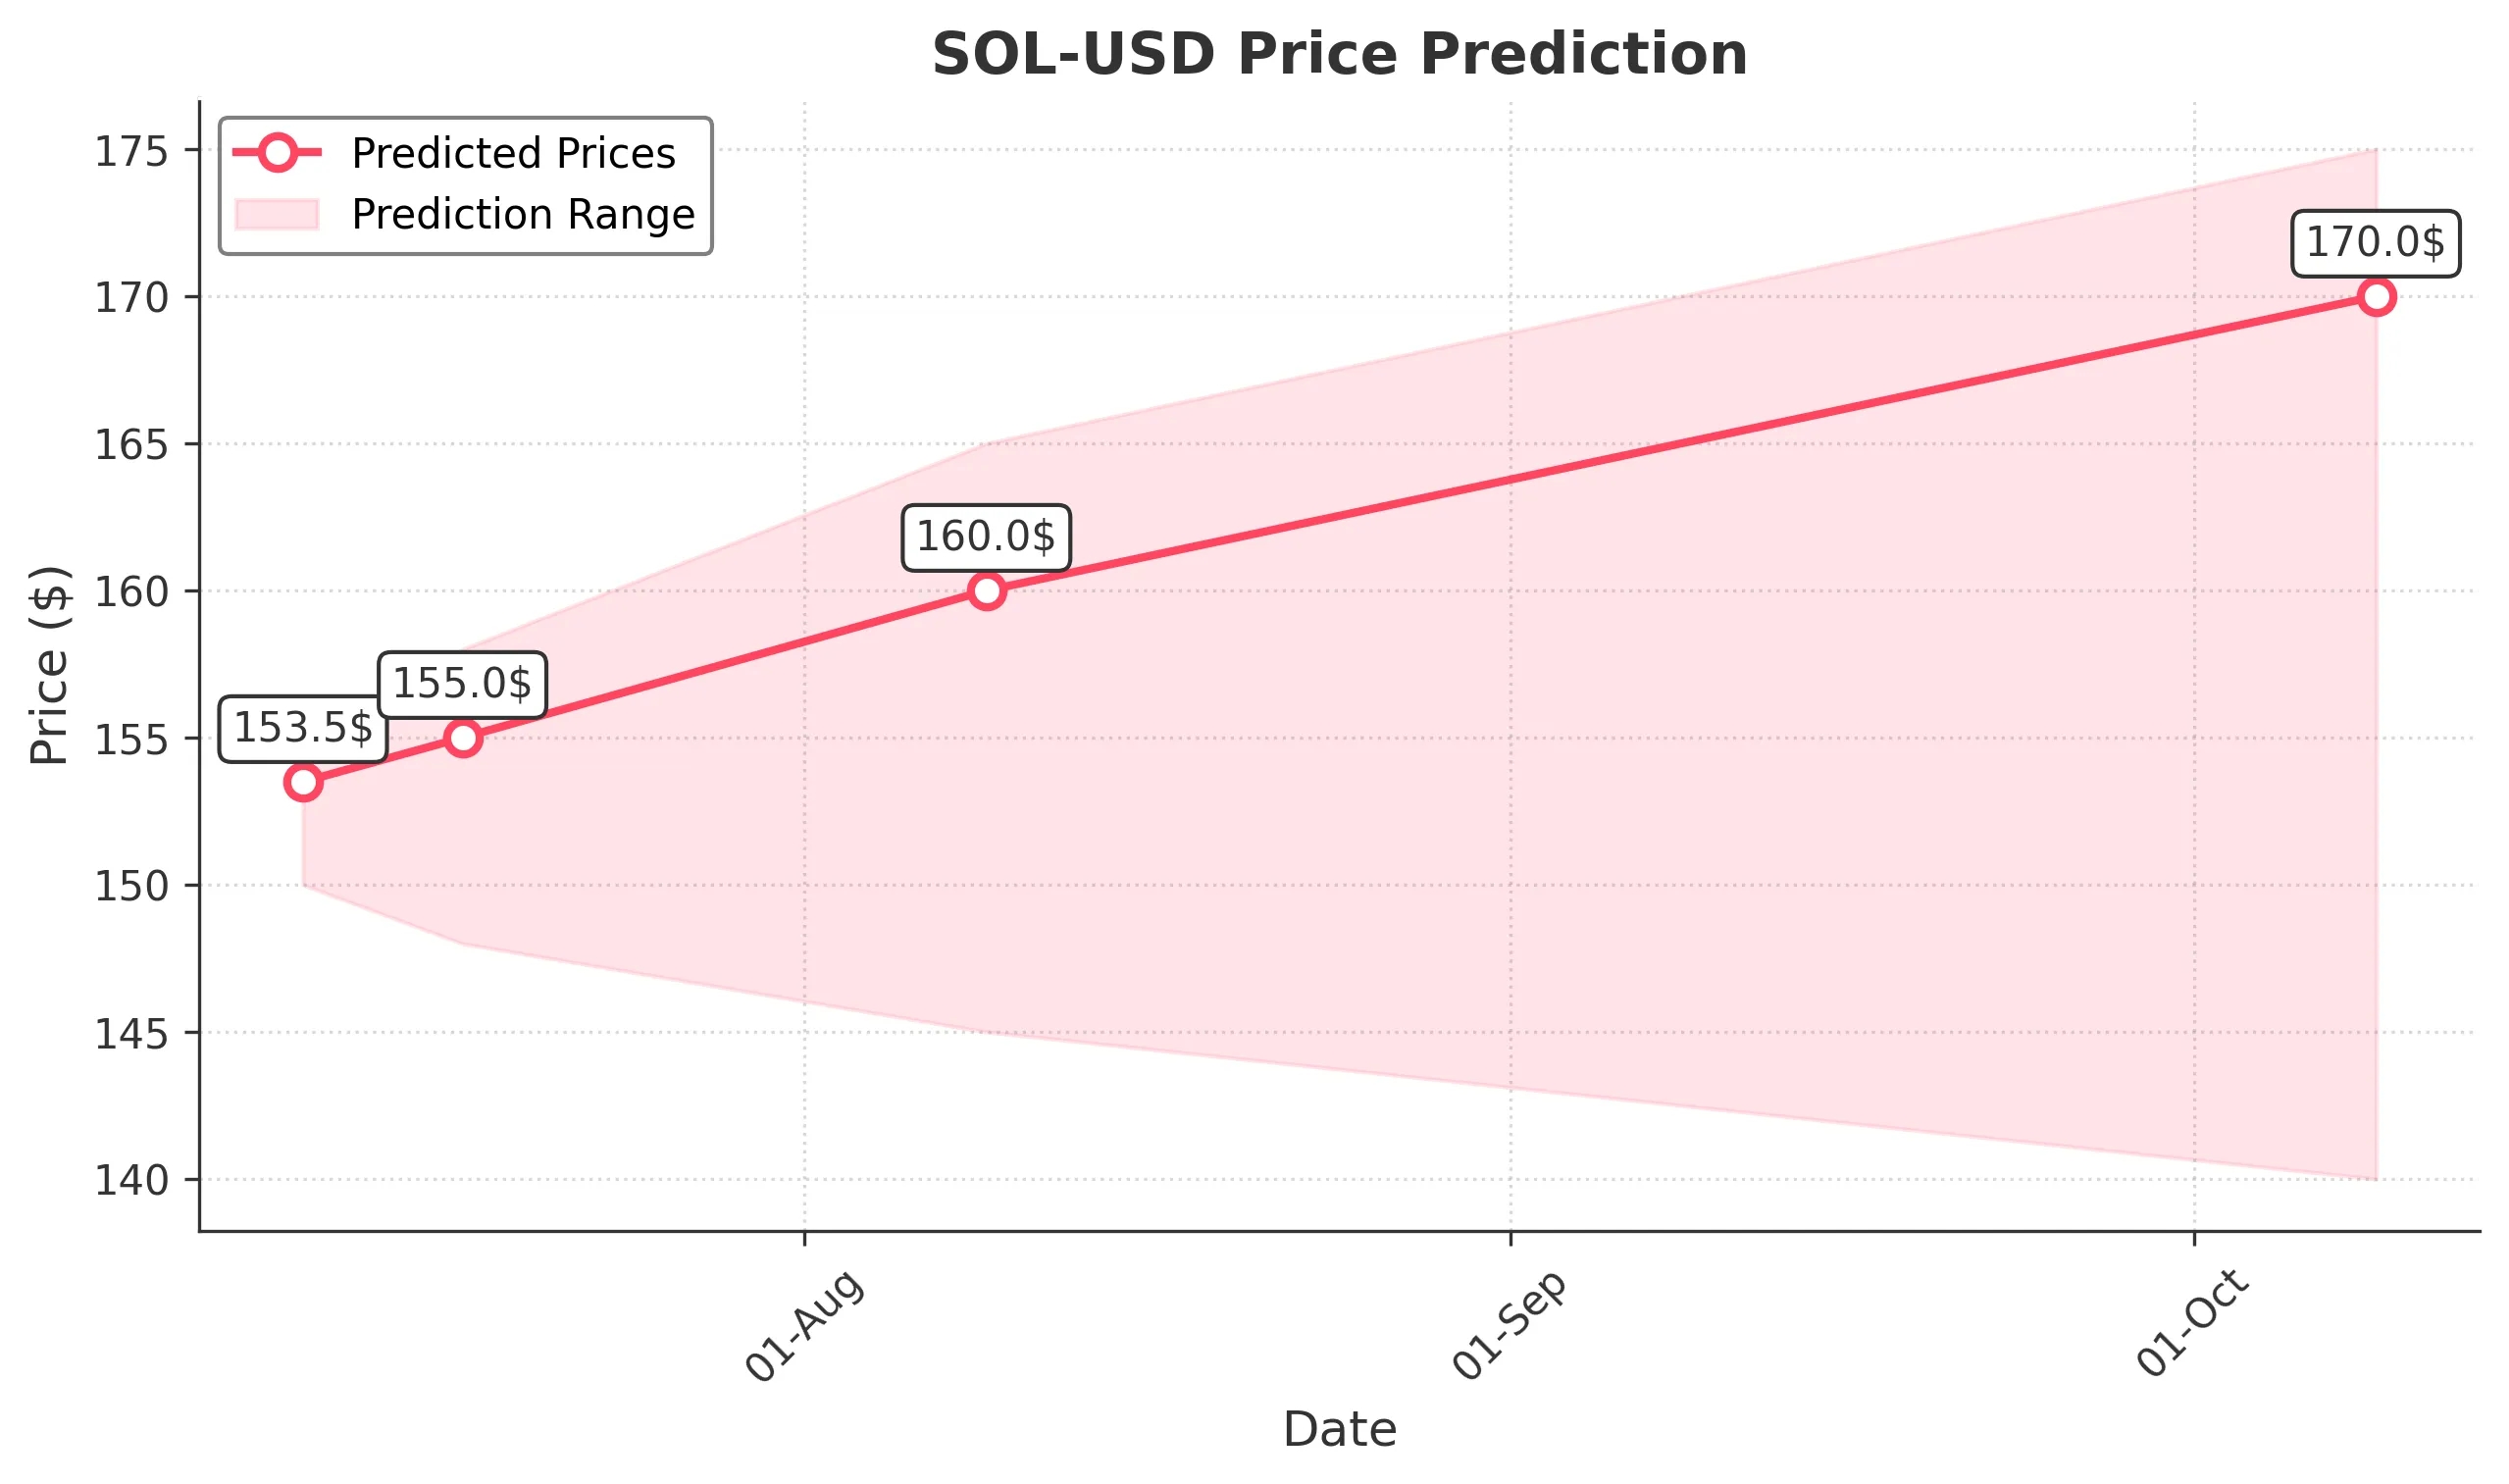
Target: July 10, 2025$153.5
$152.8
$155
$150
Description
The stock shows a slight bullish trend with recent upward momentum. The RSI is approaching overbought levels, indicating potential for a pullback. However, strong support at 150.00 may hold. Volume remains robust, suggesting continued interest.
Analysis
Over the past 3 months, SOL-USD has shown significant volatility with a bullish trend peaking around mid-May. Key support at 150.00 and resistance at 155.00 are critical. The MACD indicates bullish momentum, but RSI suggests caution as it nears overbought territory.
Confidence Level
Potential Risks
Potential for a reversal exists if market sentiment shifts or if macroeconomic news impacts trading.
1 Week Prediction
Target: July 17, 2025$155
$153.5
$158
$148
Description
The stock is expected to maintain its upward trajectory, supported by recent bullish candlestick patterns. However, the RSI indicates potential overbought conditions, which could lead to a pullback. Volume trends suggest sustained interest.
Analysis
The stock has experienced a bullish trend with significant volume spikes. Key resistance at 158.00 may pose challenges. The MACD remains positive, but caution is warranted as the RSI approaches overbought levels, indicating a possible correction.
Confidence Level
Potential Risks
Market volatility and external economic factors could impact the price, leading to unexpected fluctuations.
1 Month Prediction
Target: August 9, 2025$160
$155
$165
$145
Description
A bullish outlook is anticipated as the stock continues to attract buyers. The Fibonacci retracement levels suggest potential upward movement towards 160.00. However, the RSI indicates caution as it approaches overbought territory.
Analysis
The stock has shown a strong upward trend with significant volume. Key support at 145.00 and resistance at 165.00 are critical. The MACD remains bullish, but the RSI suggests potential overbought conditions, indicating a need for caution.
Confidence Level
Potential Risks
External market conditions and economic data releases could lead to volatility, impacting the price direction.
3 Months Prediction
Target: October 9, 2025$170
$160
$175
$140
Description
Long-term bullish sentiment is expected as the stock continues to gain traction. The MACD indicates sustained momentum, while the RSI suggests potential for a pullback. Key support at 140.00 will be crucial.
Analysis
The stock has shown a strong bullish trend with significant volume. Key support at 140.00 and resistance at 175.00 are critical. The MACD remains positive, but the RSI indicates potential overbought conditions, suggesting a need for caution.
Confidence Level
Potential Risks
Market sentiment and macroeconomic factors could lead to unexpected volatility, impacting the price trajectory.