SOL-USD Trading Predictions
1 Day Prediction
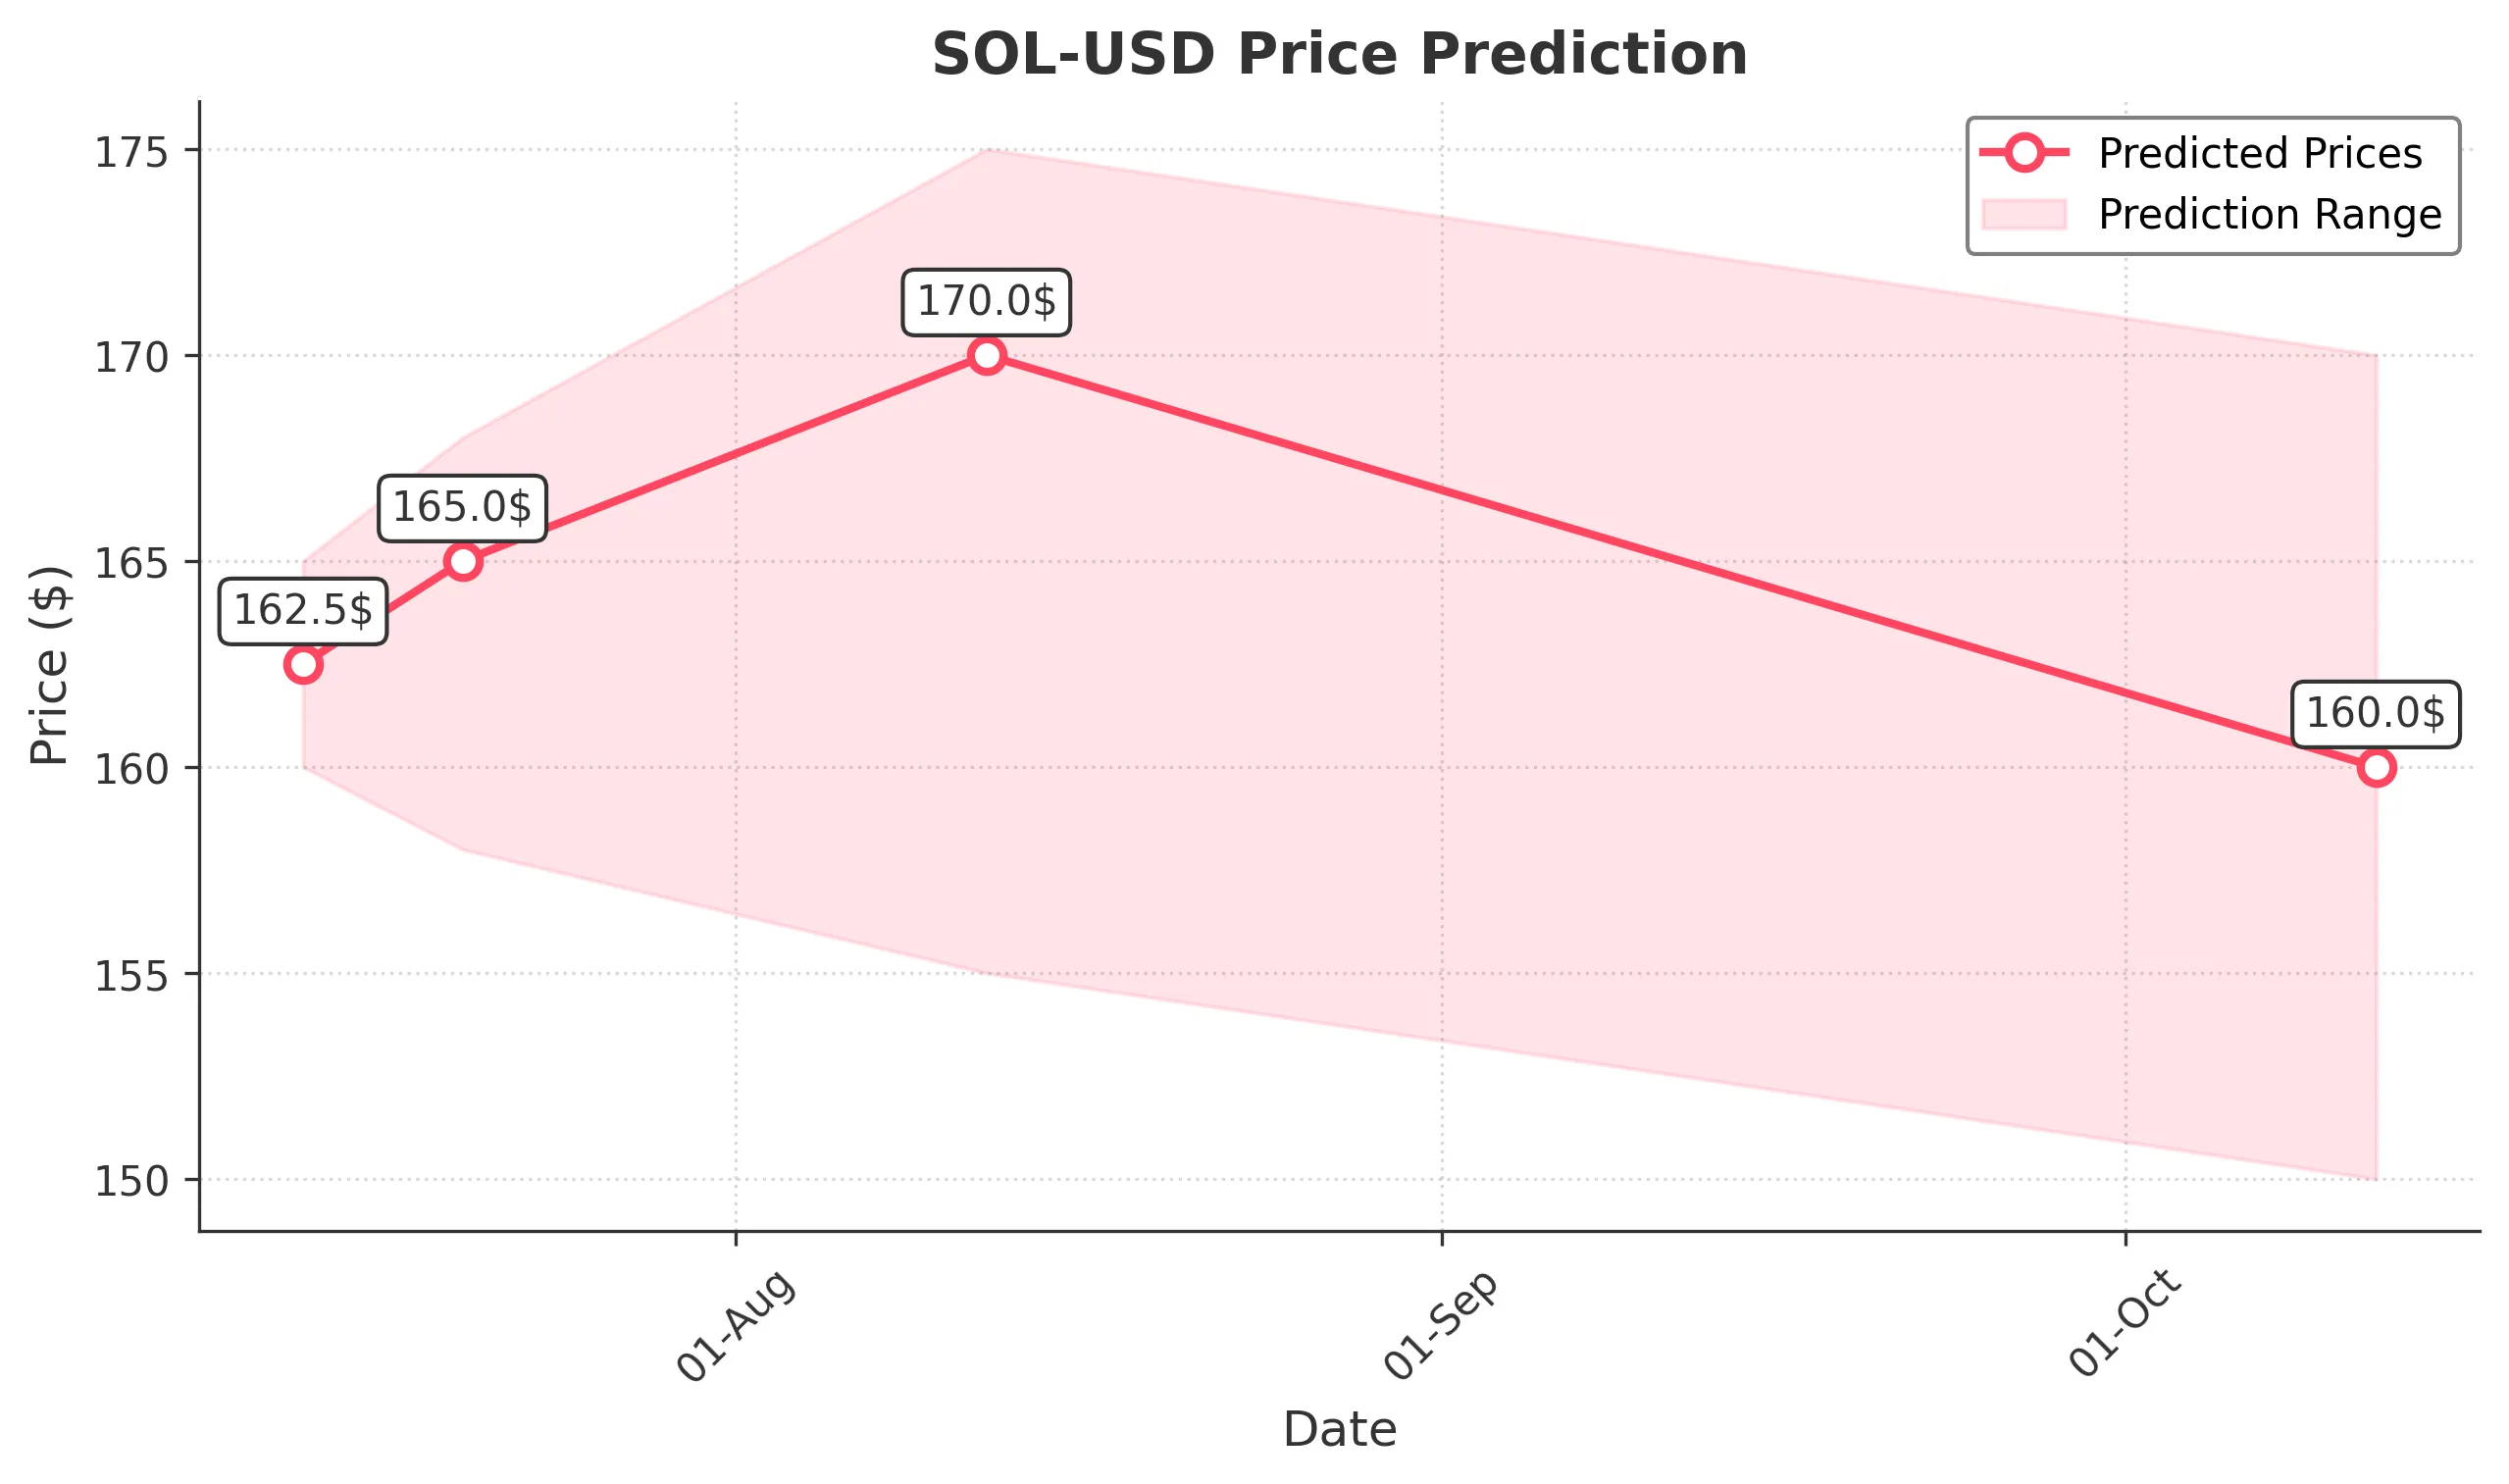
Target: July 13, 2025$162.5
$162.8
$165
$160
Description
The stock shows a slight bullish trend with a recent Doji pattern indicating indecision. RSI is neutral, and MACD is showing a potential bullish crossover. Volume remains high, suggesting strong interest. However, market sentiment is mixed, which could lead to volatility.
Analysis
Over the past 3 months, SOL-USD has shown a bullish trend with significant price increases, peaking at 184.00. Key support is around 140.00, while resistance is near 180.00. Volume spikes indicate strong buying interest, but recent candlestick patterns suggest caution.
Confidence Level
Potential Risks
Potential for a reversal exists if bearish news emerges or if profit-taking occurs after recent gains.
1 Week Prediction
Target: July 20, 2025$165
$162.5
$168
$158
Description
The stock is expected to continue its upward momentum, supported by bullish technical indicators. The MACD remains positive, and the RSI is approaching overbought territory. However, a pullback could occur if profit-taking intensifies.
Analysis
The stock has been on a bullish run, with significant volume supporting the price increases. Key resistance levels are being tested, and while the trend is strong, caution is advised as overbought conditions may lead to corrections.
Confidence Level
Potential Risks
Market volatility and external economic factors could impact the stock's performance, leading to unexpected price movements.
1 Month Prediction
Target: August 12, 2025$170
$165
$175
$155
Description
The stock is likely to maintain its bullish trend, with strong support from recent price action and volume. However, the RSI indicates potential overbought conditions, which could lead to a correction. Watch for key resistance at 175.00.
Analysis
SOL-USD has shown resilience with a strong upward trend. Key support at 155.00 and resistance at 175.00 are critical levels to watch. The overall market sentiment remains bullish, but caution is warranted due to potential overbought signals.
Confidence Level
Potential Risks
Economic indicators and market sentiment could shift, leading to increased volatility and potential price corrections.
3 Months Prediction
Target: October 12, 2025$160
$165
$170
$150
Description
Expect a potential pullback as the stock may face resistance at higher levels. The MACD could turn bearish, and RSI may indicate overbought conditions. Market sentiment could shift due to macroeconomic factors, impacting the price.
Analysis
The stock has experienced a strong bullish trend, but signs of potential exhaustion are emerging. Key support at 150.00 and resistance at 175.00 will be crucial in determining future price action. Overall, the market remains volatile.
Confidence Level
Potential Risks
Unforeseen macroeconomic events or changes in market sentiment could lead to significant price fluctuations.