SOL-USD Trading Predictions
1 Day Prediction
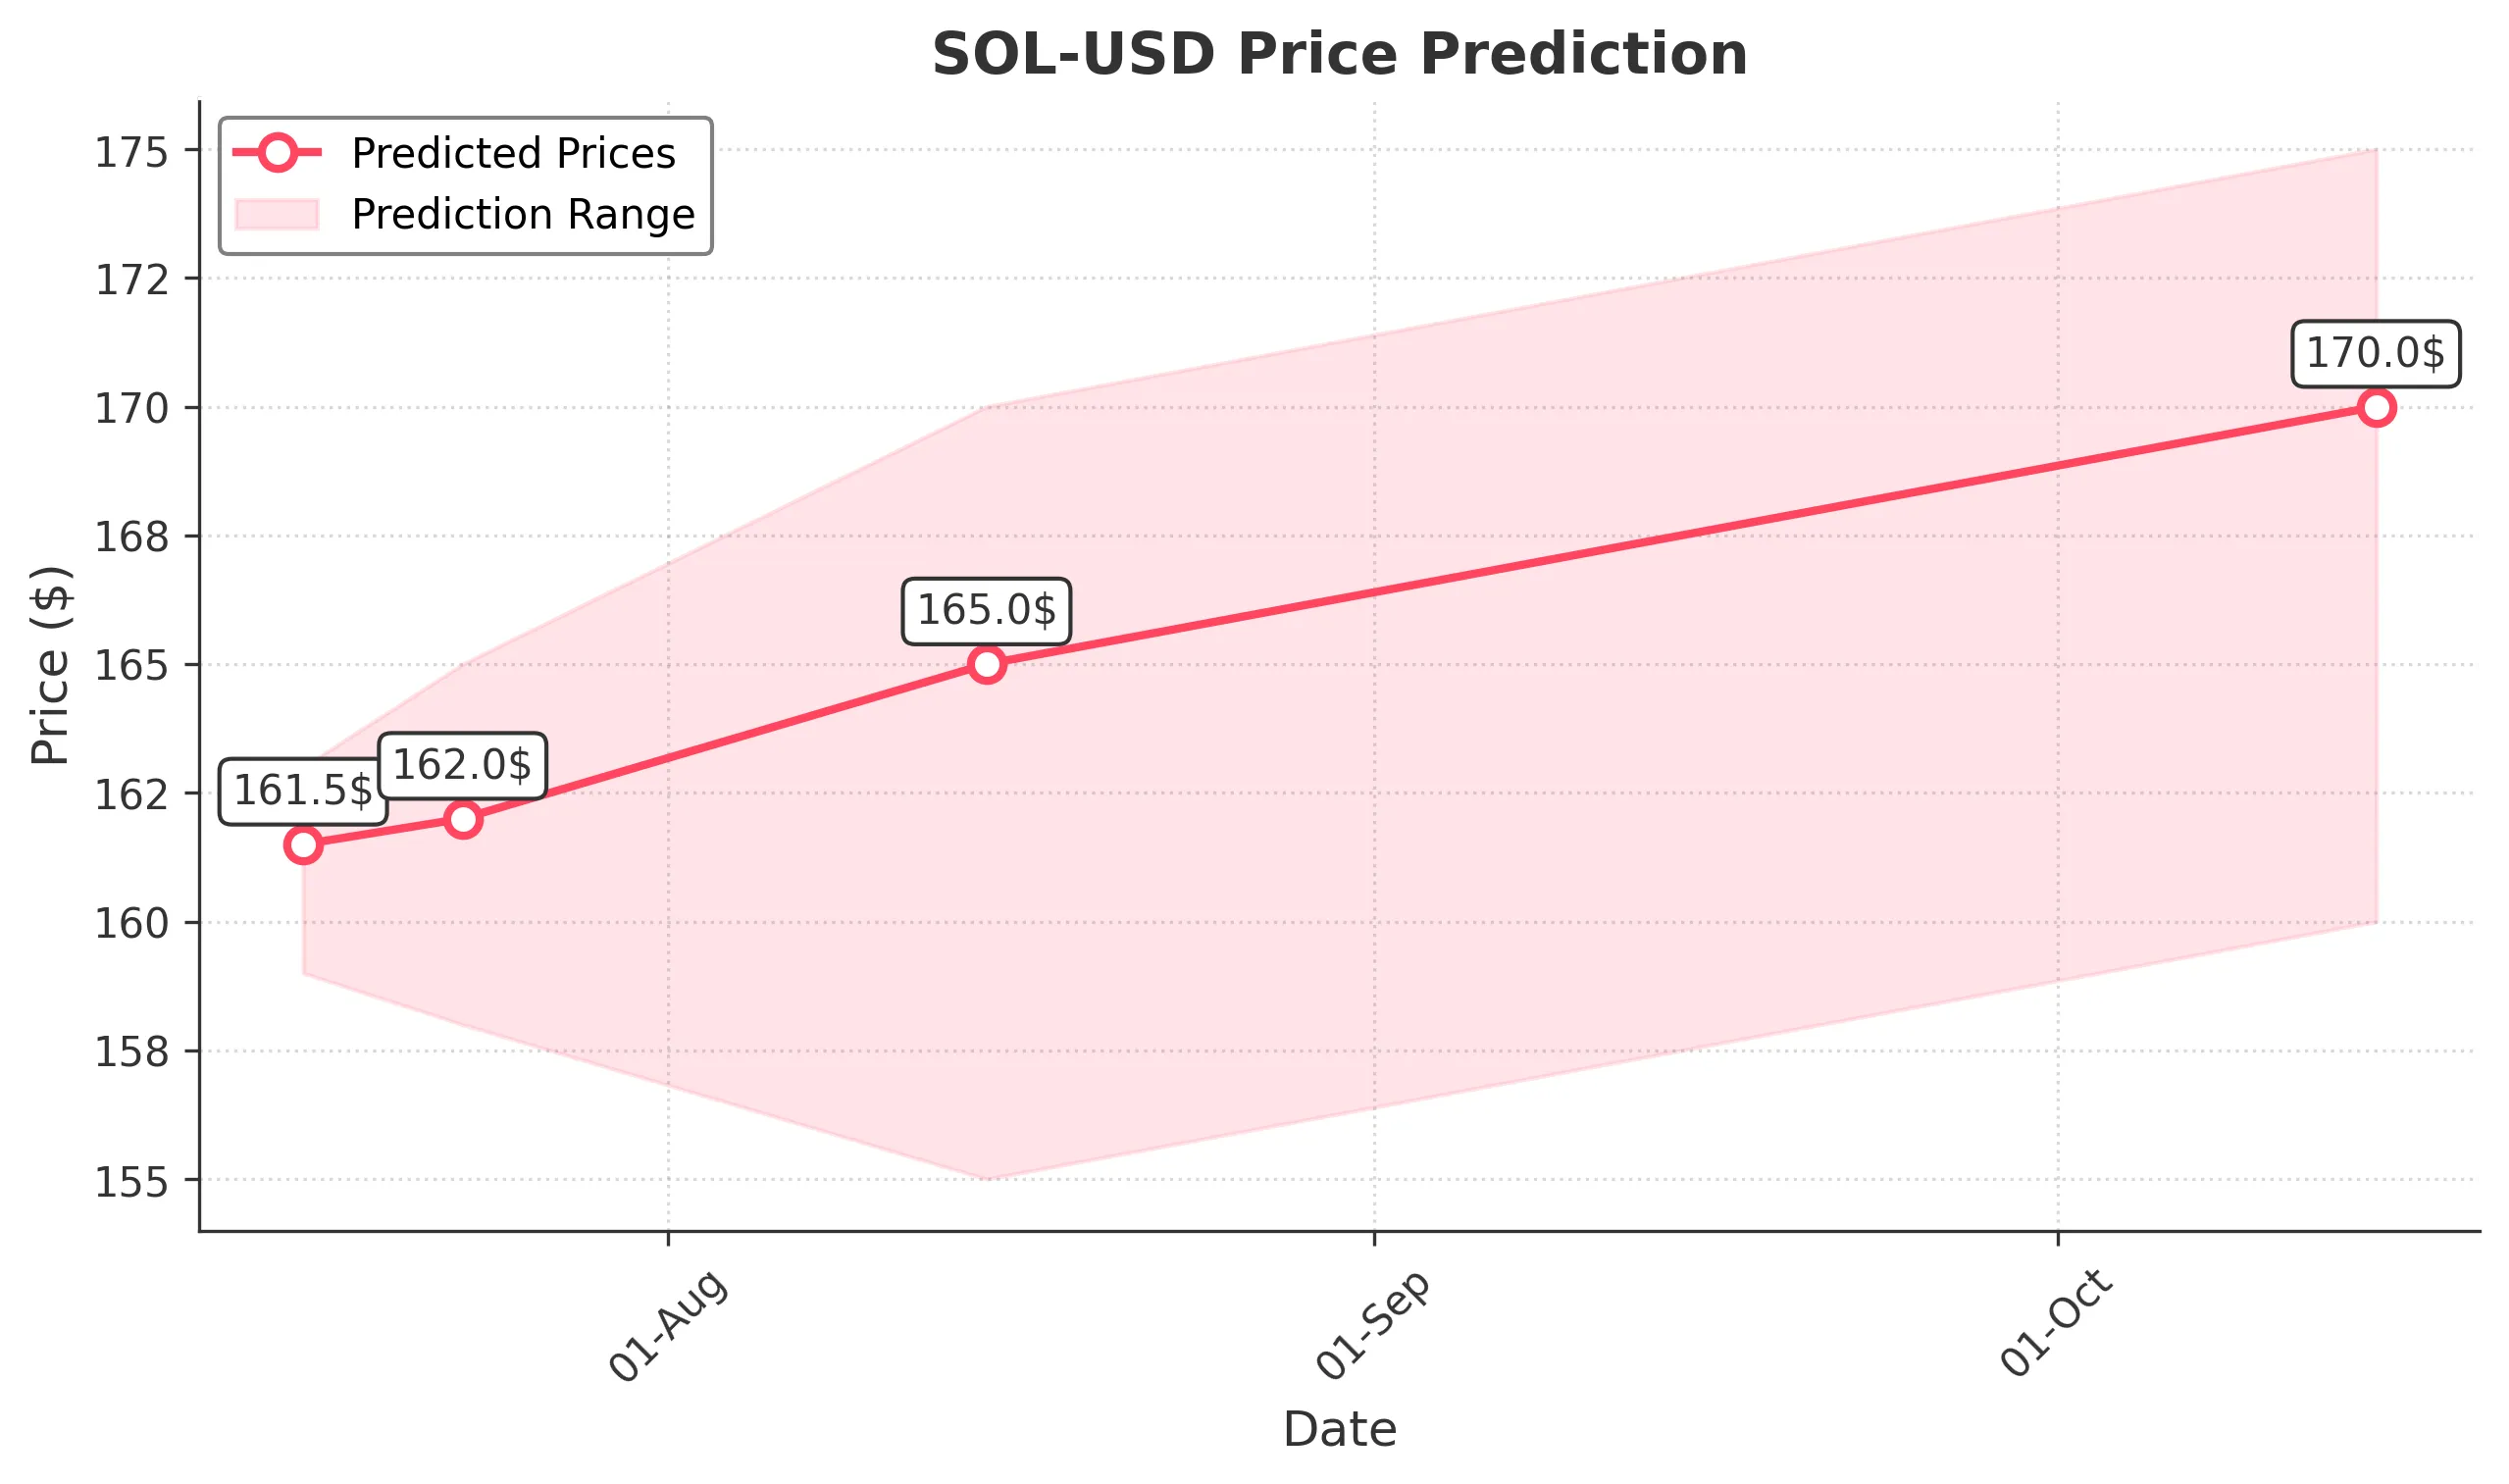
Target: July 16, 2025$161.5
$160.5
$163
$159
Description
The stock shows a slight bullish trend with a recent Doji pattern indicating indecision. The RSI is neutral, suggesting potential for upward movement. However, MACD is flattening, indicating possible consolidation. Volume remains high, supporting the price action.
Analysis
Over the past 3 months, SOL-USD has shown significant volatility with a bullish trend peaking in early July. Key support at $160 and resistance at $170. RSI indicates overbought conditions, while MACD shows potential for a pullback. Volume spikes suggest strong interest.
Confidence Level
Potential Risks
Market volatility and external news could impact the price. A sudden bearish sentiment could reverse the trend.
1 Week Prediction
Target: July 23, 2025$162
$161
$165
$158
Description
The stock is expected to maintain its upward momentum, supported by recent bullish candlestick patterns. The MACD indicates a potential bullish crossover, while the RSI remains in a healthy range. Volume trends suggest sustained interest.
Analysis
The stock has been in a bullish phase, with significant price increases. Key resistance at $170 remains a challenge. The ATR indicates increasing volatility, and the recent volume spikes suggest strong buying interest. However, caution is warranted due to overbought conditions.
Confidence Level
Potential Risks
Potential market corrections or negative news could lead to unexpected price drops.
1 Month Prediction
Target: August 15, 2025$165
$162
$170
$155
Description
The stock is likely to continue its upward trend, with Fibonacci retracement levels indicating support around $160. The MACD remains bullish, and the RSI is approaching overbought territory, suggesting a potential pullback.
Analysis
SOL-USD has shown strong performance with a bullish trend. Key support at $160 and resistance at $170. The RSI indicates potential overbought conditions, while MACD supports continued upward momentum. Volume patterns suggest sustained interest, but caution is advised.
Confidence Level
Potential Risks
Market sentiment can shift quickly, and any negative macroeconomic news could impact the stock's performance.
3 Months Prediction
Target: October 15, 2025$170
$165
$175
$160
Description
The stock is expected to reach new highs, driven by strong market sentiment and bullish technical indicators. The MACD suggests continued upward momentum, while the RSI may indicate overbought conditions, warranting caution.
Analysis
In the past 3 months, SOL-USD has shown a strong bullish trend with significant price increases. Key resistance at $175 and support at $160. The MACD indicates bullish momentum, while the RSI suggests potential overbought conditions. Volume trends indicate strong interest, but market sentiment can shift.
Confidence Level
Potential Risks
Long-term predictions are subject to market volatility and external economic factors that could lead to price corrections.