SOL-USD Trading Predictions
1 Day Prediction
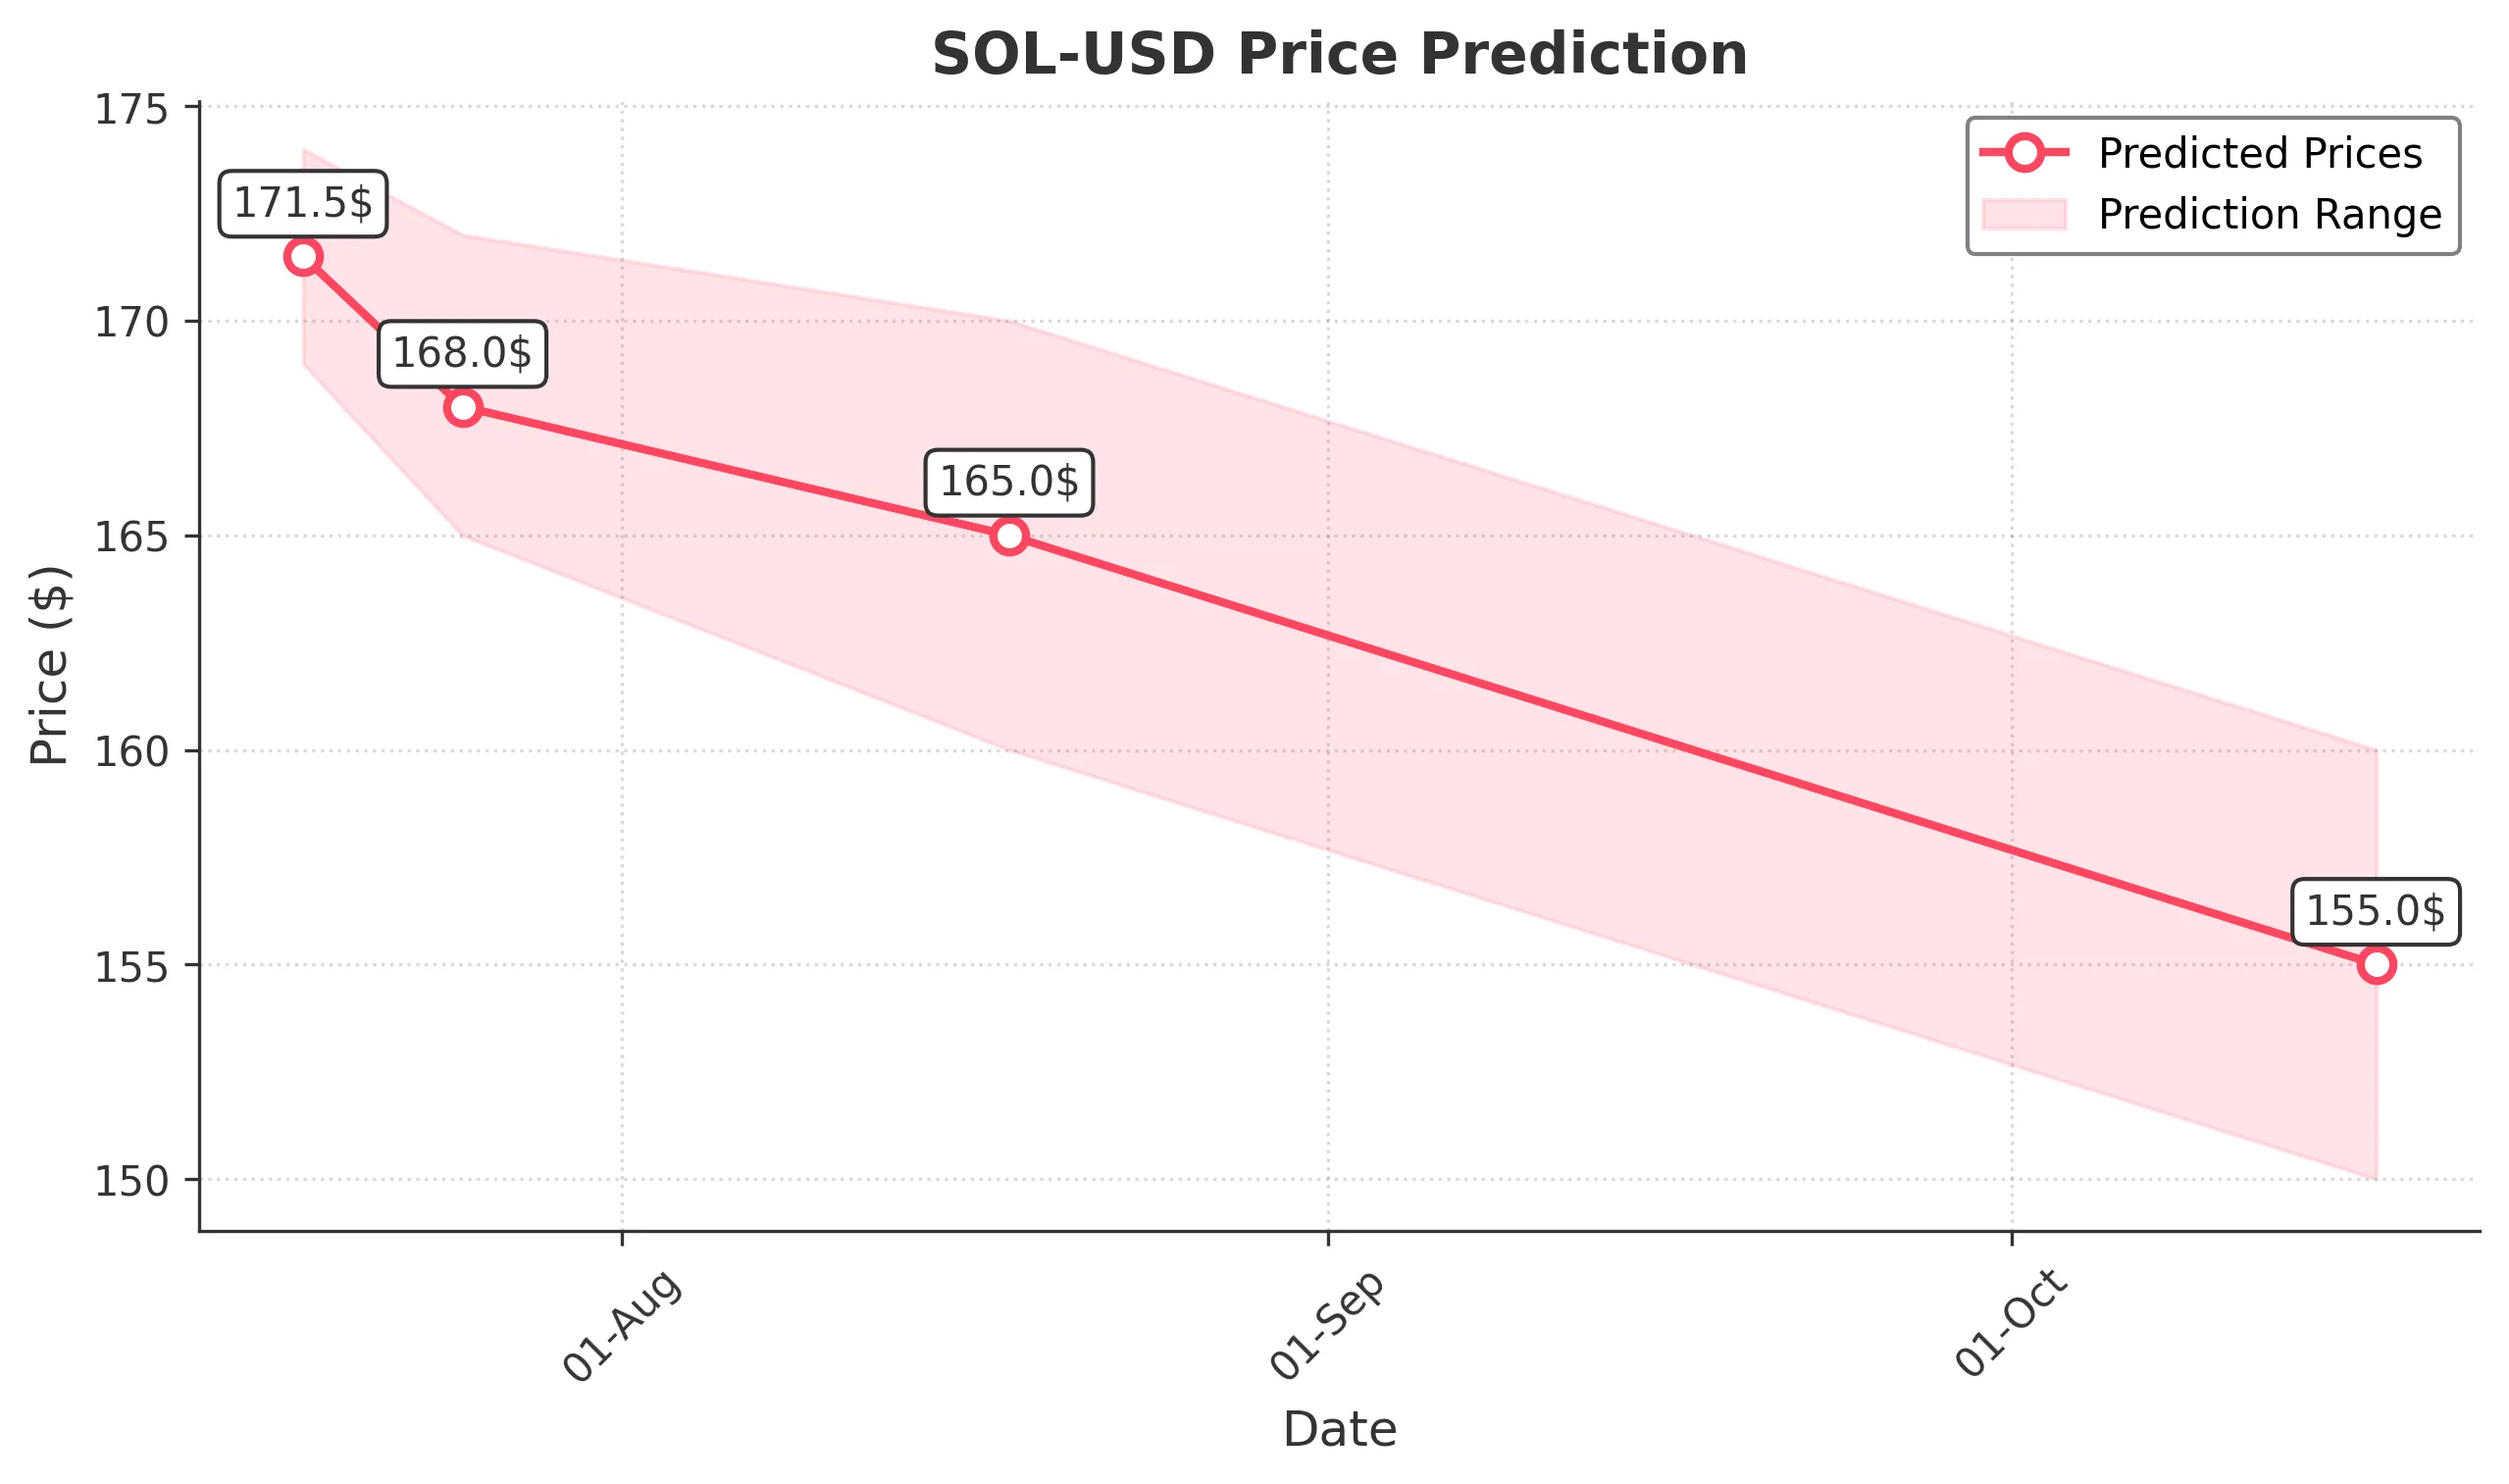
Target: July 18, 2025$171.5
$172
$174
$169
Description
The stock shows a slight bearish trend with a potential pullback after recent highs. RSI indicates overbought conditions, while MACD shows a bearish crossover. Expect volatility due to high trading volume.
Analysis
Over the past 3 months, SOL-USD has shown a bullish trend with significant price increases. Key resistance at $175 and support around $160. Recent volume spikes indicate strong interest, but overbought conditions suggest a possible correction.
Confidence Level
Potential Risks
Market sentiment may shift rapidly, and external news could impact price movements.
1 Week Prediction
Target: July 25, 2025$168
$170
$172
$165
Description
A potential downward trend is expected as the stock may face resistance at $175. The RSI is approaching overbought levels, indicating a possible correction. Watch for volume spikes that could signal reversals.
Analysis
The stock has experienced significant fluctuations, with a recent peak at $175. Support levels are around $160. Technical indicators suggest a potential pullback, but strong buying interest remains.
Confidence Level
Potential Risks
Unforeseen market events or news could lead to volatility, impacting the accuracy of this prediction.
1 Month Prediction
Target: August 18, 2025$165
$167
$170
$160
Description
Expect a continued bearish trend as the stock may test lower support levels. The MACD indicates weakening momentum, and RSI suggests potential overselling. Volume may decrease as traders reassess positions.
Analysis
The stock has shown volatility with a recent peak and subsequent decline. Key support at $160 is critical. Technical indicators suggest a bearish outlook, but market sentiment remains mixed.
Confidence Level
Potential Risks
Market sentiment can change quickly, and external factors may influence price movements significantly.
3 Months Prediction
Target: October 17, 2025$155
$158
$160
$150
Description
A bearish outlook is anticipated as the stock may continue to decline towards key support levels. The overall market sentiment is cautious, and technical indicators suggest further downside potential.
Analysis
The stock has been on a rollercoaster, with significant highs followed by corrections. Key support at $150 is crucial. Technical indicators show bearish signals, and external economic factors may further influence performance.
Confidence Level
Potential Risks
Economic conditions and market sentiment could shift, leading to unexpected price movements.