SOL-USD Trading Predictions
1 Day Prediction
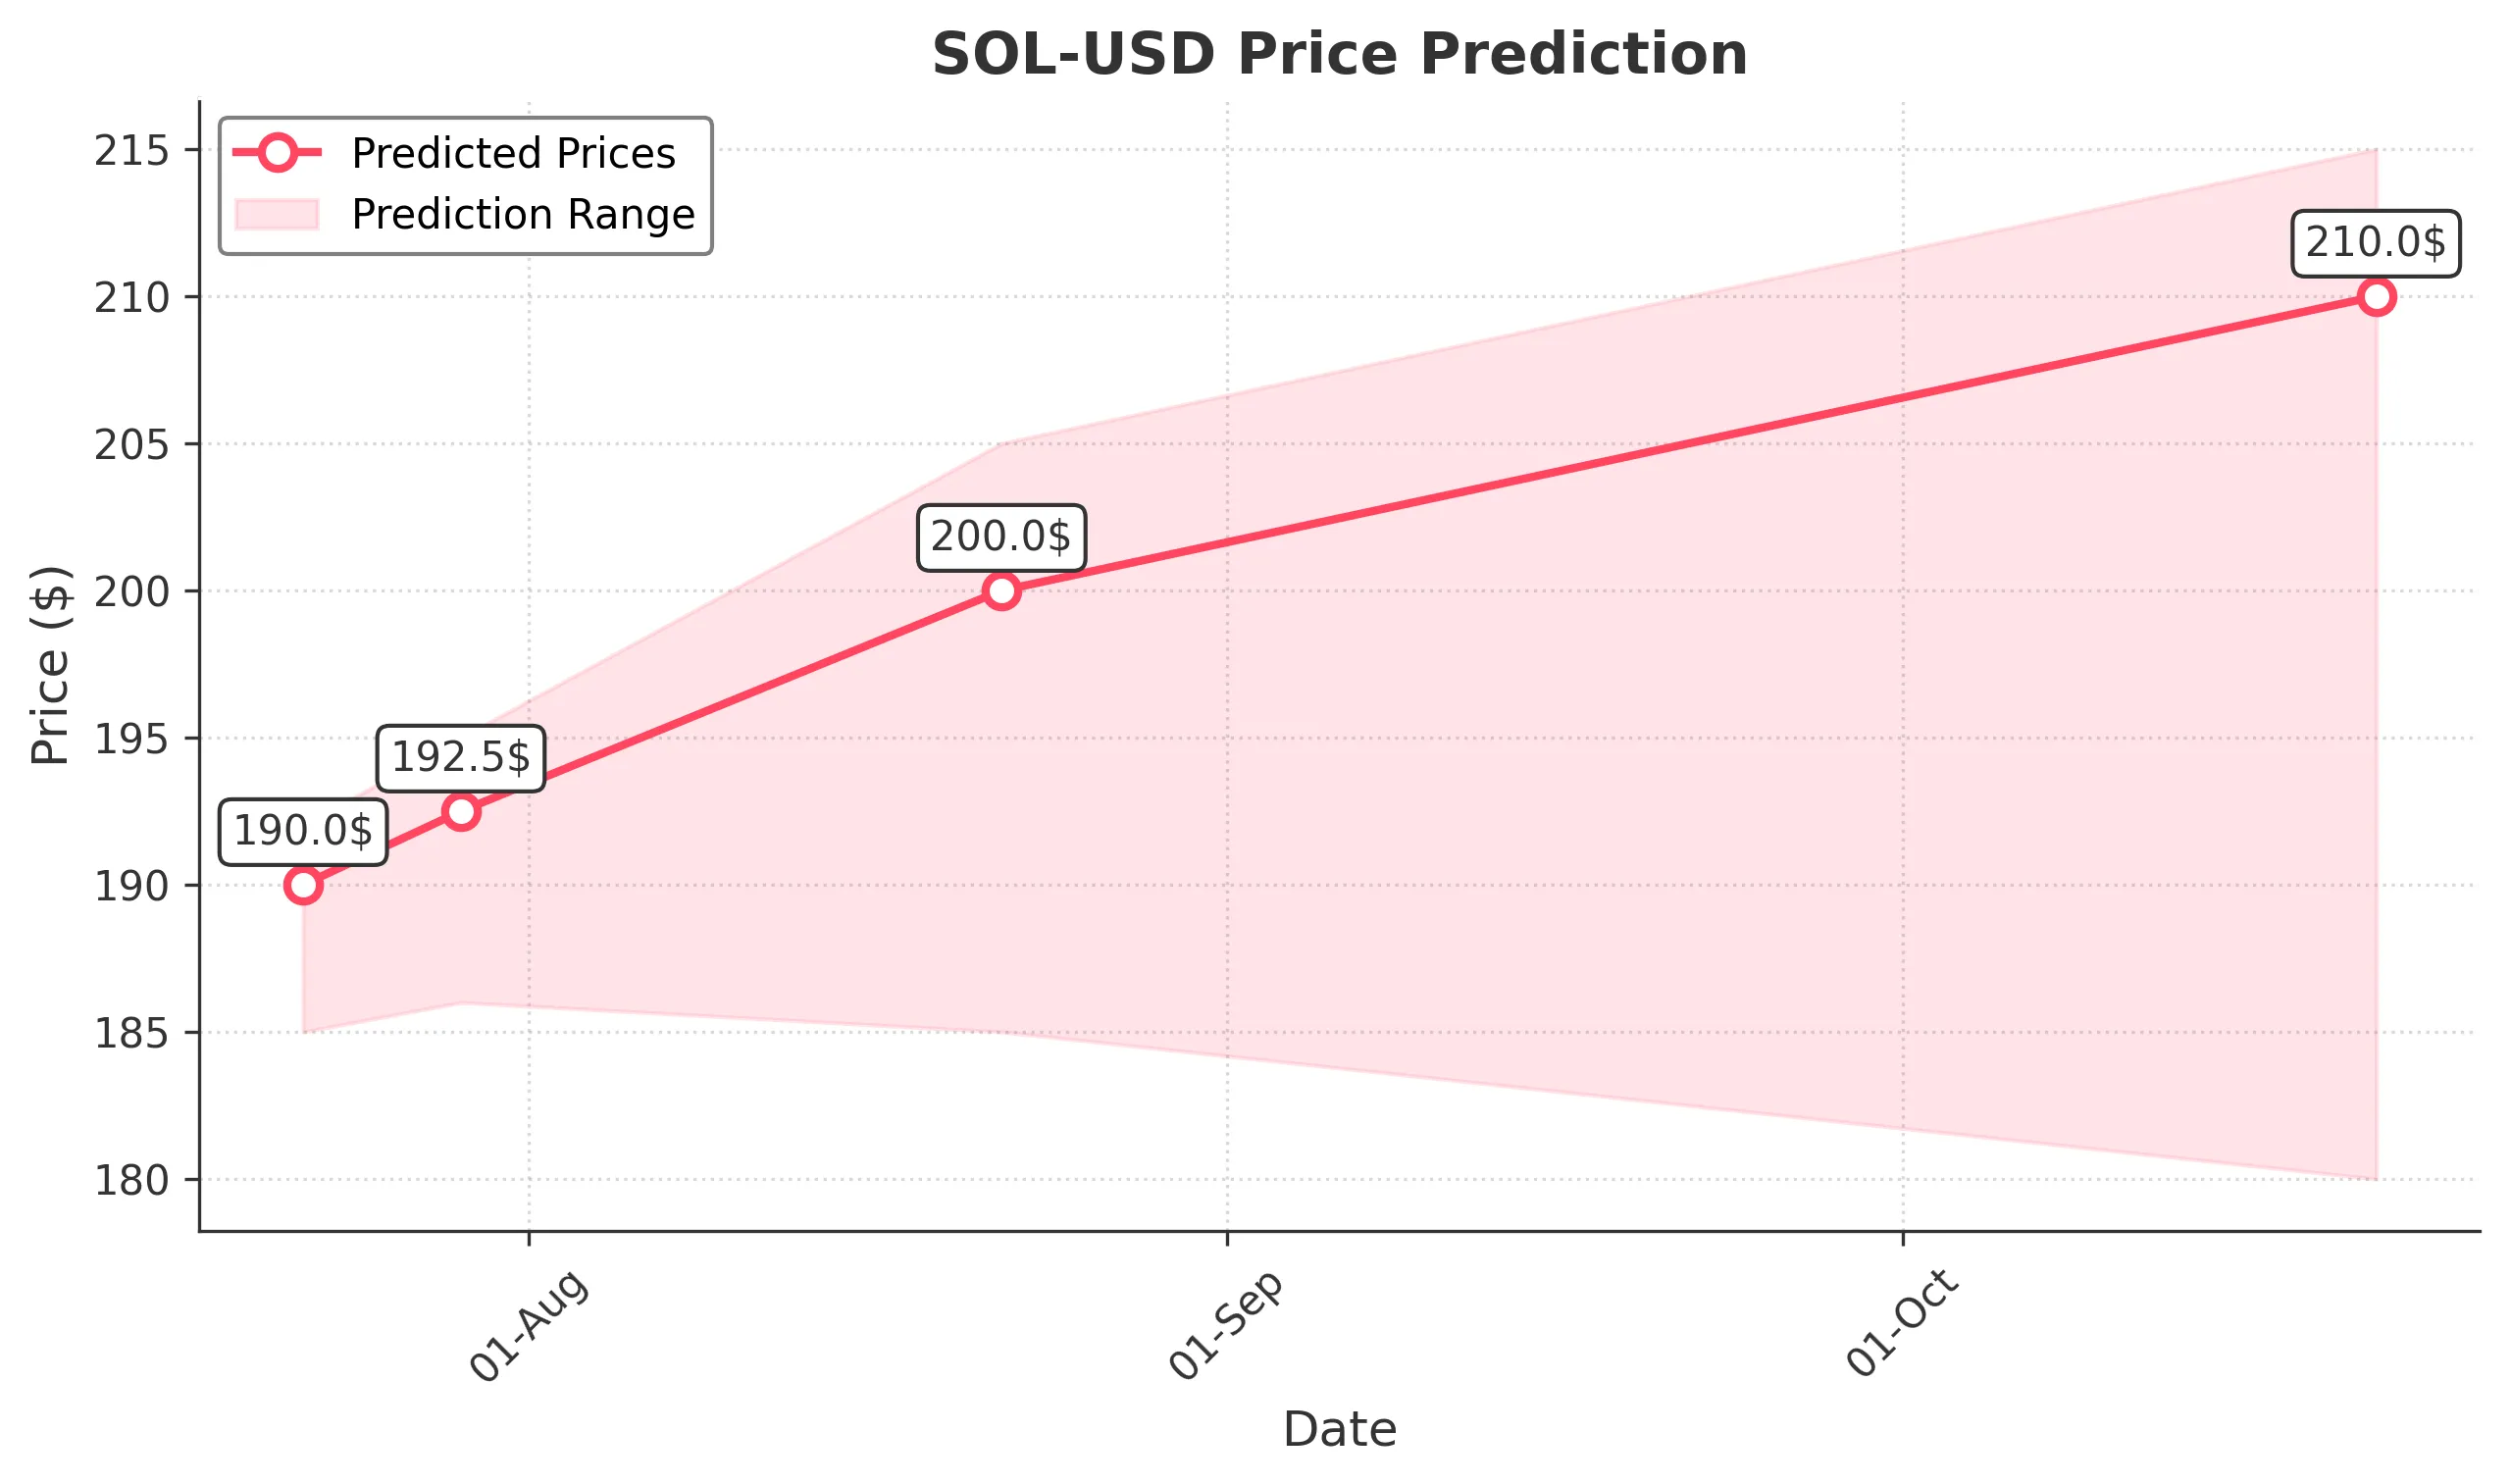
Target: July 22, 2025$190
$189.5
$192
$185
Description
The stock shows strong bullish momentum with recent highs and increasing volume. The RSI is approaching overbought levels, indicating potential for a pullback, but the overall trend remains upward. MACD is positive, supporting further gains.
Analysis
Over the past 3 months, SOL-USD has shown a bullish trend, with significant support at $175 and resistance around $190. Volume spikes indicate strong buying interest. Technical indicators like MACD and moving averages confirm upward momentum, but RSI suggests caution.
Confidence Level
Potential Risks
Potential for a short-term pullback due to overbought conditions. Market sentiment could shift quickly based on external news.
1 Week Prediction
Target: July 29, 2025$192.5
$190
$195
$186
Description
The bullish trend is expected to continue, with strong support at $185. The MACD remains positive, and the price is likely to test the $195 resistance level. However, watch for potential volatility as the RSI approaches overbought territory.
Analysis
The stock has maintained a bullish trend, with key support at $175 and resistance at $195. Recent volume trends indicate strong buying interest, but the RSI suggests caution as it nears overbought levels. Overall, the outlook remains positive.
Confidence Level
Potential Risks
Market volatility and potential profit-taking could lead to fluctuations. External economic factors may also impact sentiment.
1 Month Prediction
Target: August 22, 2025$200
$192.5
$205
$185
Description
The stock is projected to reach $200 as bullish momentum continues. The MACD and moving averages support this upward trend, but the RSI indicates potential overbought conditions. Watch for corrections around resistance levels.
Analysis
SOL-USD has shown a strong upward trajectory, with significant support at $175 and resistance at $200. Volume patterns indicate sustained interest, but the RSI suggests caution. The overall sentiment remains bullish, but external factors could introduce volatility.
Confidence Level
Potential Risks
Possible corrections if the RSI remains overbought. Market sentiment can shift rapidly, impacting price stability.
3 Months Prediction
Target: October 22, 2025$210
$200
$215
$180
Description
Long-term bullish outlook with potential to reach $210. The stock is likely to consolidate around $200 before breaking higher. Watch for market sentiment shifts and macroeconomic influences that could impact volatility.
Analysis
The stock has shown a strong bullish trend, with key support at $180 and resistance at $215. Volume trends indicate strong buying interest, but the RSI suggests caution. Overall, while the outlook is positive, external factors could introduce significant risks.
Confidence Level
Potential Risks
Market corrections and external economic factors could lead to volatility. The potential for a bearish reversal exists if sentiment shifts.