SOL-USD Trading Predictions
1 Day Prediction
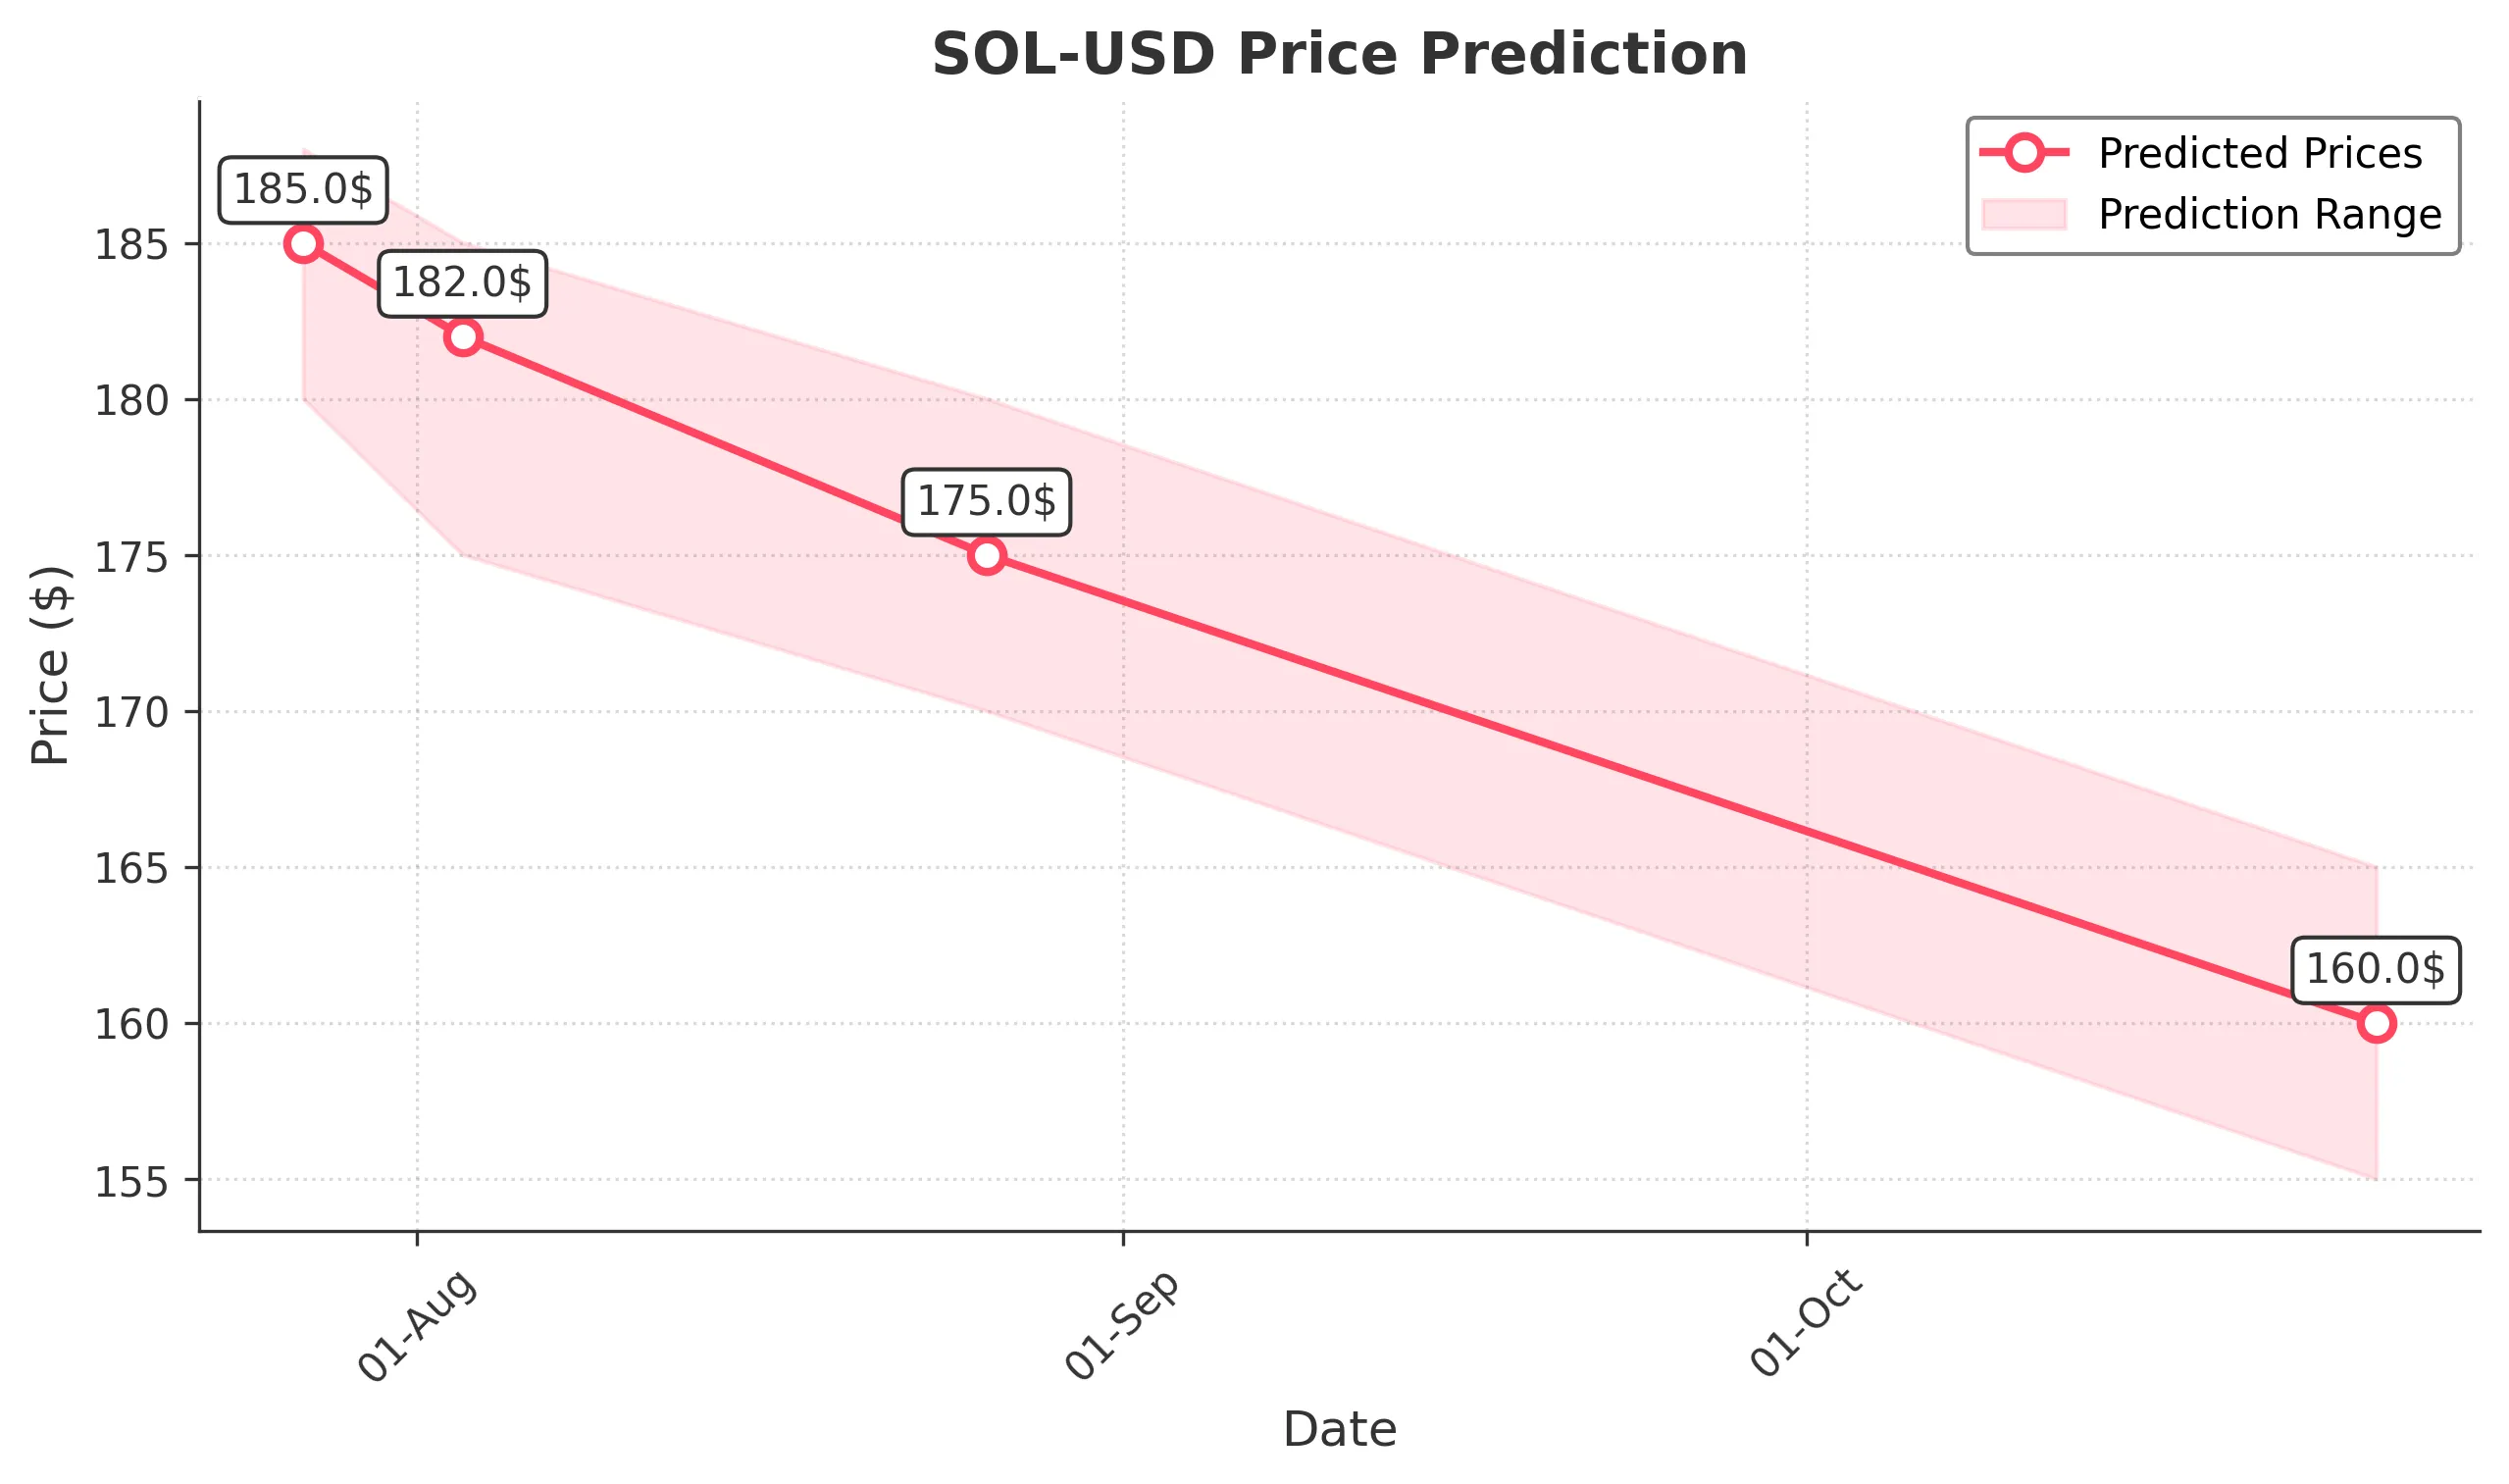
Target: July 27, 2025$185
$185
$188
$180
Description
The stock shows a bullish trend with strong momentum from recent highs. RSI indicates overbought conditions, suggesting a potential pullback. However, the overall sentiment remains positive, supported by high trading volume.
Analysis
The past three months show a bullish trend with significant price increases, especially in late July. Key resistance at $205.70 and support around $180. Recent volume spikes indicate strong interest, but overbought conditions may lead to volatility.
Confidence Level
Potential Risks
Potential for a short-term correction due to overbought RSI levels and profit-taking.
1 Week Prediction
Target: August 3, 2025$182
$180
$185
$175
Description
Expect a slight pullback as profit-taking may occur after recent highs. The MACD shows signs of divergence, indicating potential weakening momentum. Volume may decrease as traders reassess positions.
Analysis
The stock has shown strong upward movement but is approaching resistance levels. The recent high volume indicates strong interest, but the RSI suggests overbought conditions. A correction could occur, leading to a sideways trend.
Confidence Level
Potential Risks
Market sentiment could shift quickly based on macroeconomic news or earnings reports.
1 Month Prediction
Target: August 26, 2025$175
$178
$180
$170
Description
A bearish trend may develop as the stock faces resistance. The Fibonacci retracement levels suggest a potential pullback to $175. Volume may stabilize as traders await clearer signals.
Analysis
The stock's performance shows a strong bullish trend, but recent highs may lead to profit-taking. Key support at $170 and resistance at $205. The market sentiment is mixed, with potential for a correction.
Confidence Level
Potential Risks
Uncertainty in market conditions and potential macroeconomic impacts could lead to unexpected volatility.
3 Months Prediction
Target: October 26, 2025$160
$162
$165
$155
Description
Long-term bearish sentiment may develop as the stock approaches key support levels. The MACD indicates a potential downtrend, and volume may decrease as traders become cautious.
Analysis
The stock has shown significant volatility with a recent bullish trend. However, the potential for a downturn exists as it approaches key support levels. The overall market sentiment is cautious, and external factors may influence future performance.
Confidence Level
Potential Risks
Market volatility and external economic factors could significantly impact the stock's performance.