SOL-USD Trading Predictions
1 Day Prediction
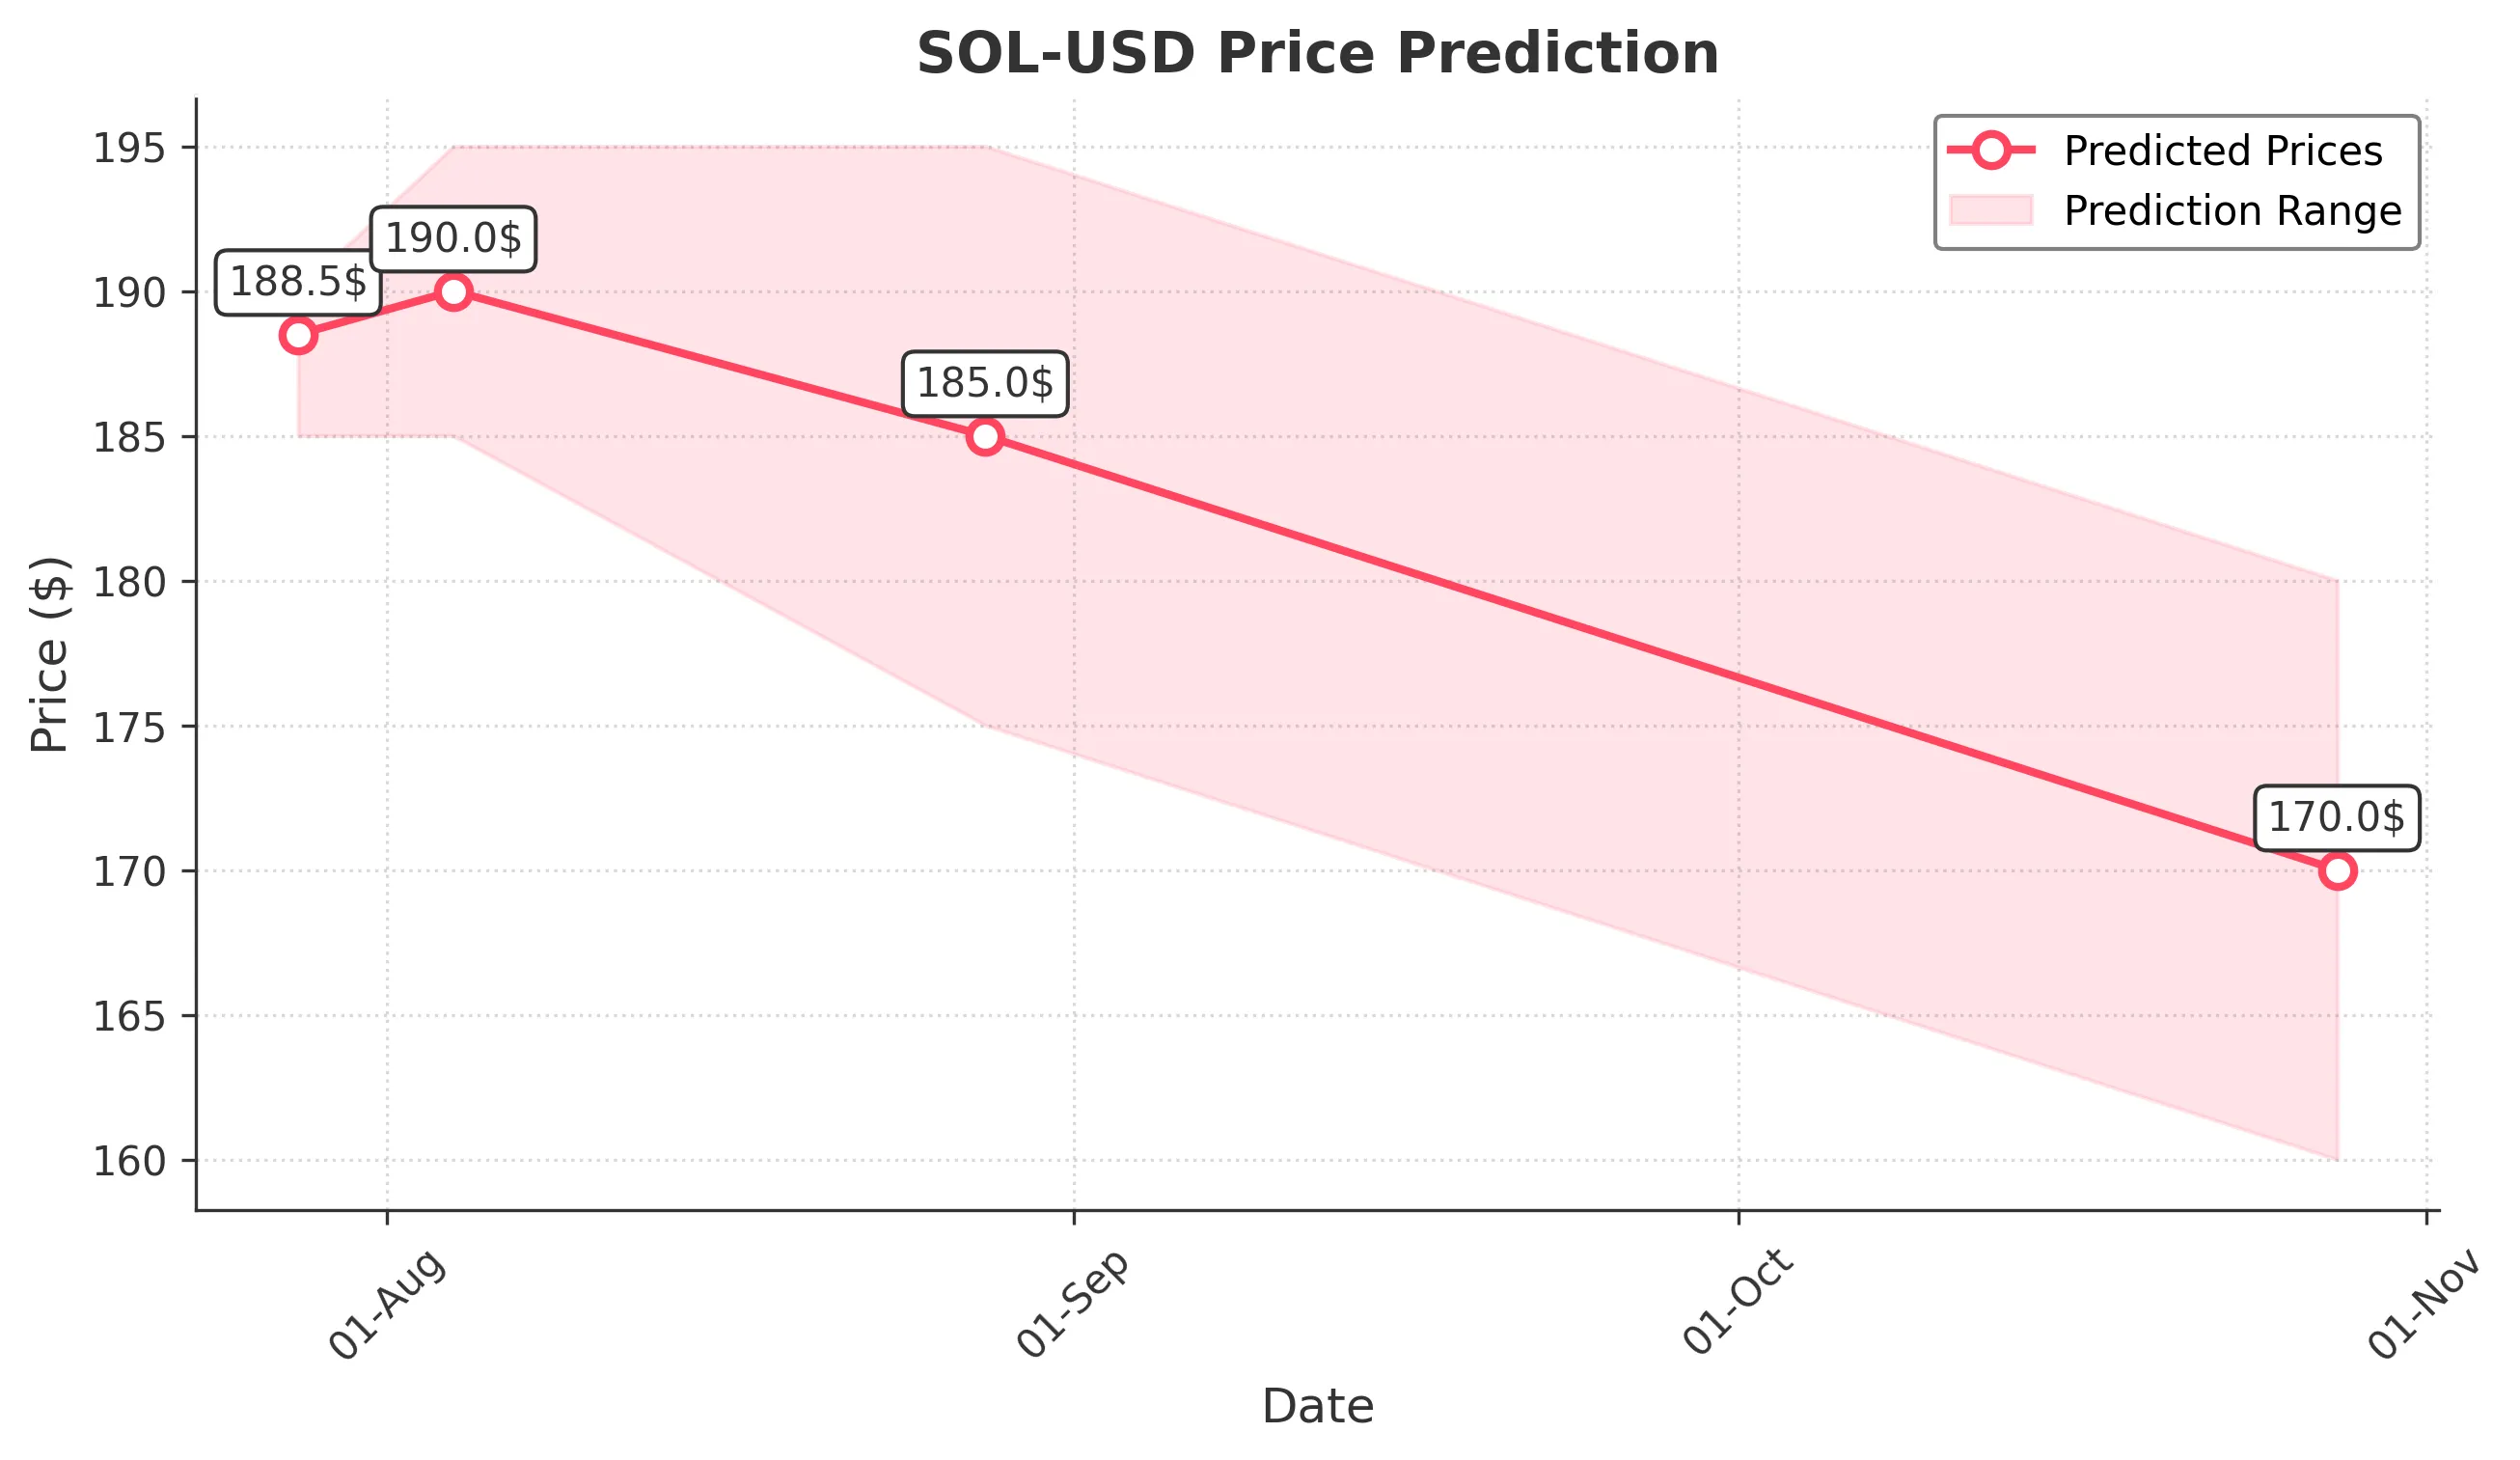
Target: July 28, 2025$188.5
$187.5
$190
$185
Description
The stock shows bullish momentum with a recent upward trend. The RSI is approaching overbought levels, indicating potential for a pullback. However, strong volume suggests continued interest. Watch for resistance at 190.
Analysis
Over the past 3 months, SOL-USD has shown a bullish trend with significant price increases. Key support is around 180, while resistance is at 190. Volume spikes indicate strong buying interest, but RSI suggests caution.
Confidence Level
Potential Risks
Potential for a short-term pullback due to overbought RSI conditions.
1 Week Prediction
Target: August 4, 2025$190
$188
$195
$185
Description
The bullish trend is expected to continue, with potential for a breakout above 190. However, the MACD shows signs of divergence, indicating a possible reversal. Monitor for volume changes.
Analysis
The stock has been on a strong upward trajectory, with significant volume supporting the price increases. Key resistance at 195 may pose challenges, while support remains at 180. Watch for any bearish signals.
Confidence Level
Potential Risks
Market volatility and potential profit-taking could impact the price.
1 Month Prediction
Target: August 28, 2025$185
$190
$195
$175
Description
Expect a correction as the stock may face resistance at 195. The RSI indicates overbought conditions, suggesting a pullback. Volume may decrease as traders take profits.
Analysis
The stock has experienced significant gains, but the overbought RSI and potential resistance at 195 suggest a correction may be imminent. Key support at 175 will be crucial in the coming weeks.
Confidence Level
Potential Risks
Unforeseen market events or news could lead to increased volatility.
3 Months Prediction
Target: October 28, 2025$170
$175
$180
$160
Description
Longer-term outlook suggests a bearish trend as profit-taking and market corrections may drive prices lower. Watch for support at 160, as a break could lead to further declines.
Analysis
The stock's performance over the last three months has been strong, but signs of potential reversal and profit-taking could lead to a bearish trend. Key support at 160 will be critical to watch.
Confidence Level
Potential Risks
Market sentiment and macroeconomic factors could significantly impact the price.