SOL-USD Trading Predictions
1 Day Prediction
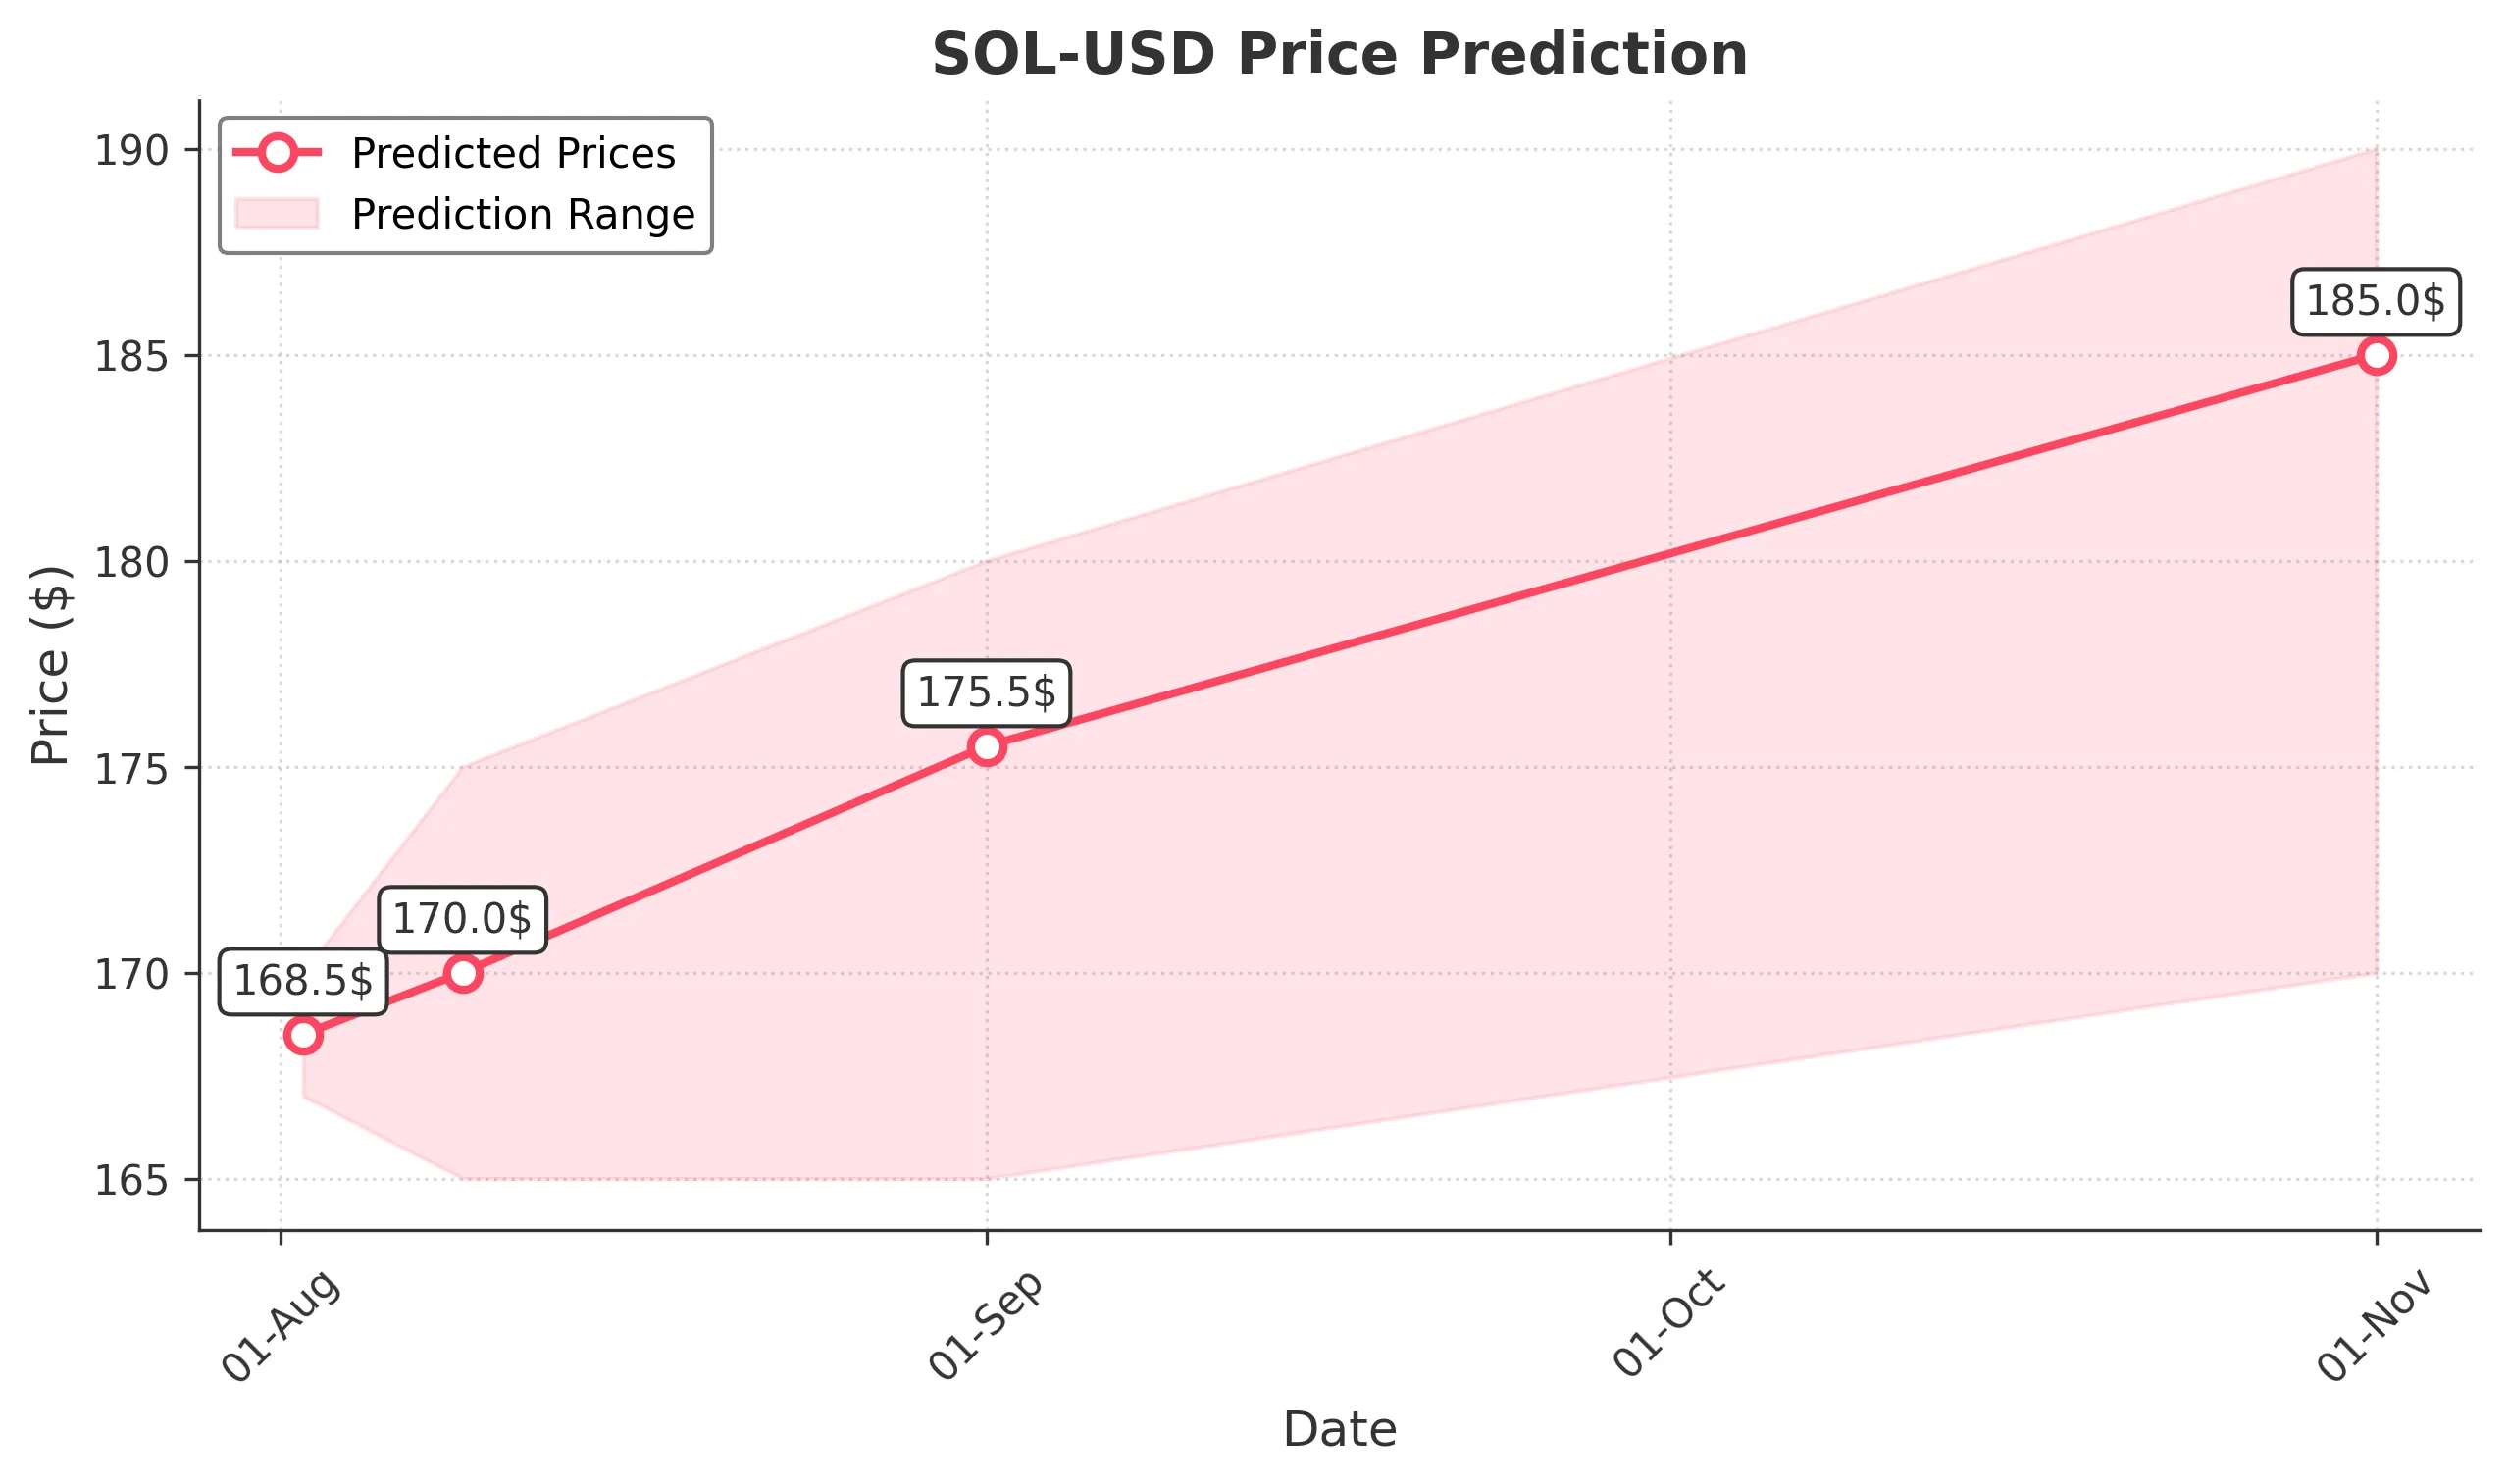
Target: August 2, 2025$168.5
$169
$170
$167
Description
The stock shows a slight bullish trend with a potential bounce from recent lows. RSI indicates oversold conditions, while MACD suggests a bullish crossover. However, volatility remains high, and market sentiment is mixed.
Analysis
Over the past 3 months, SOL-USD has experienced significant fluctuations, with a recent bearish trend. Key support at $168 and resistance at $180. Volume spikes indicate strong interest, but the overall trend is uncertain.
Confidence Level
Potential Risks
Market volatility and external news could impact the price significantly.
1 Week Prediction
Target: August 9, 2025$170
$168.5
$175
$165
Description
Expect a gradual recovery as the stock may find support at $168. The bullish divergence in RSI and MACD suggests potential upward momentum, but resistance at $175 could limit gains.
Analysis
The stock has shown a bearish trend recently, with significant resistance at $175. Volume analysis indicates strong trading activity, but the overall market sentiment remains cautious.
Confidence Level
Potential Risks
Potential for a reversal if market sentiment shifts negatively or if macroeconomic factors come into play.
1 Month Prediction
Target: September 1, 2025$175.5
$170
$180
$165
Description
A potential bullish reversal is indicated as the stock approaches key Fibonacci retracement levels. However, the market remains volatile, and external factors could influence price movements.
Analysis
The stock has been volatile, with key support at $165 and resistance at $180. Technical indicators show mixed signals, and volume patterns suggest fluctuating investor interest.
Confidence Level
Potential Risks
Uncertainty in market conditions and potential bearish news could lead to unexpected price drops.
3 Months Prediction
Target: November 1, 2025$185
$175.5
$190
$170
Description
Long-term bullish sentiment may prevail if the stock breaks above $180. Continued interest in the crypto market and positive macroeconomic indicators could support this upward trend.
Analysis
The stock has shown a mix of bullish and bearish trends over the past three months. Key resistance at $180 and support at $170 are critical levels to watch. Overall market sentiment remains cautious but optimistic.
Confidence Level
Potential Risks
Market corrections and external economic factors could lead to volatility and price adjustments.