SOL-USD Trading Predictions
1 Day Prediction
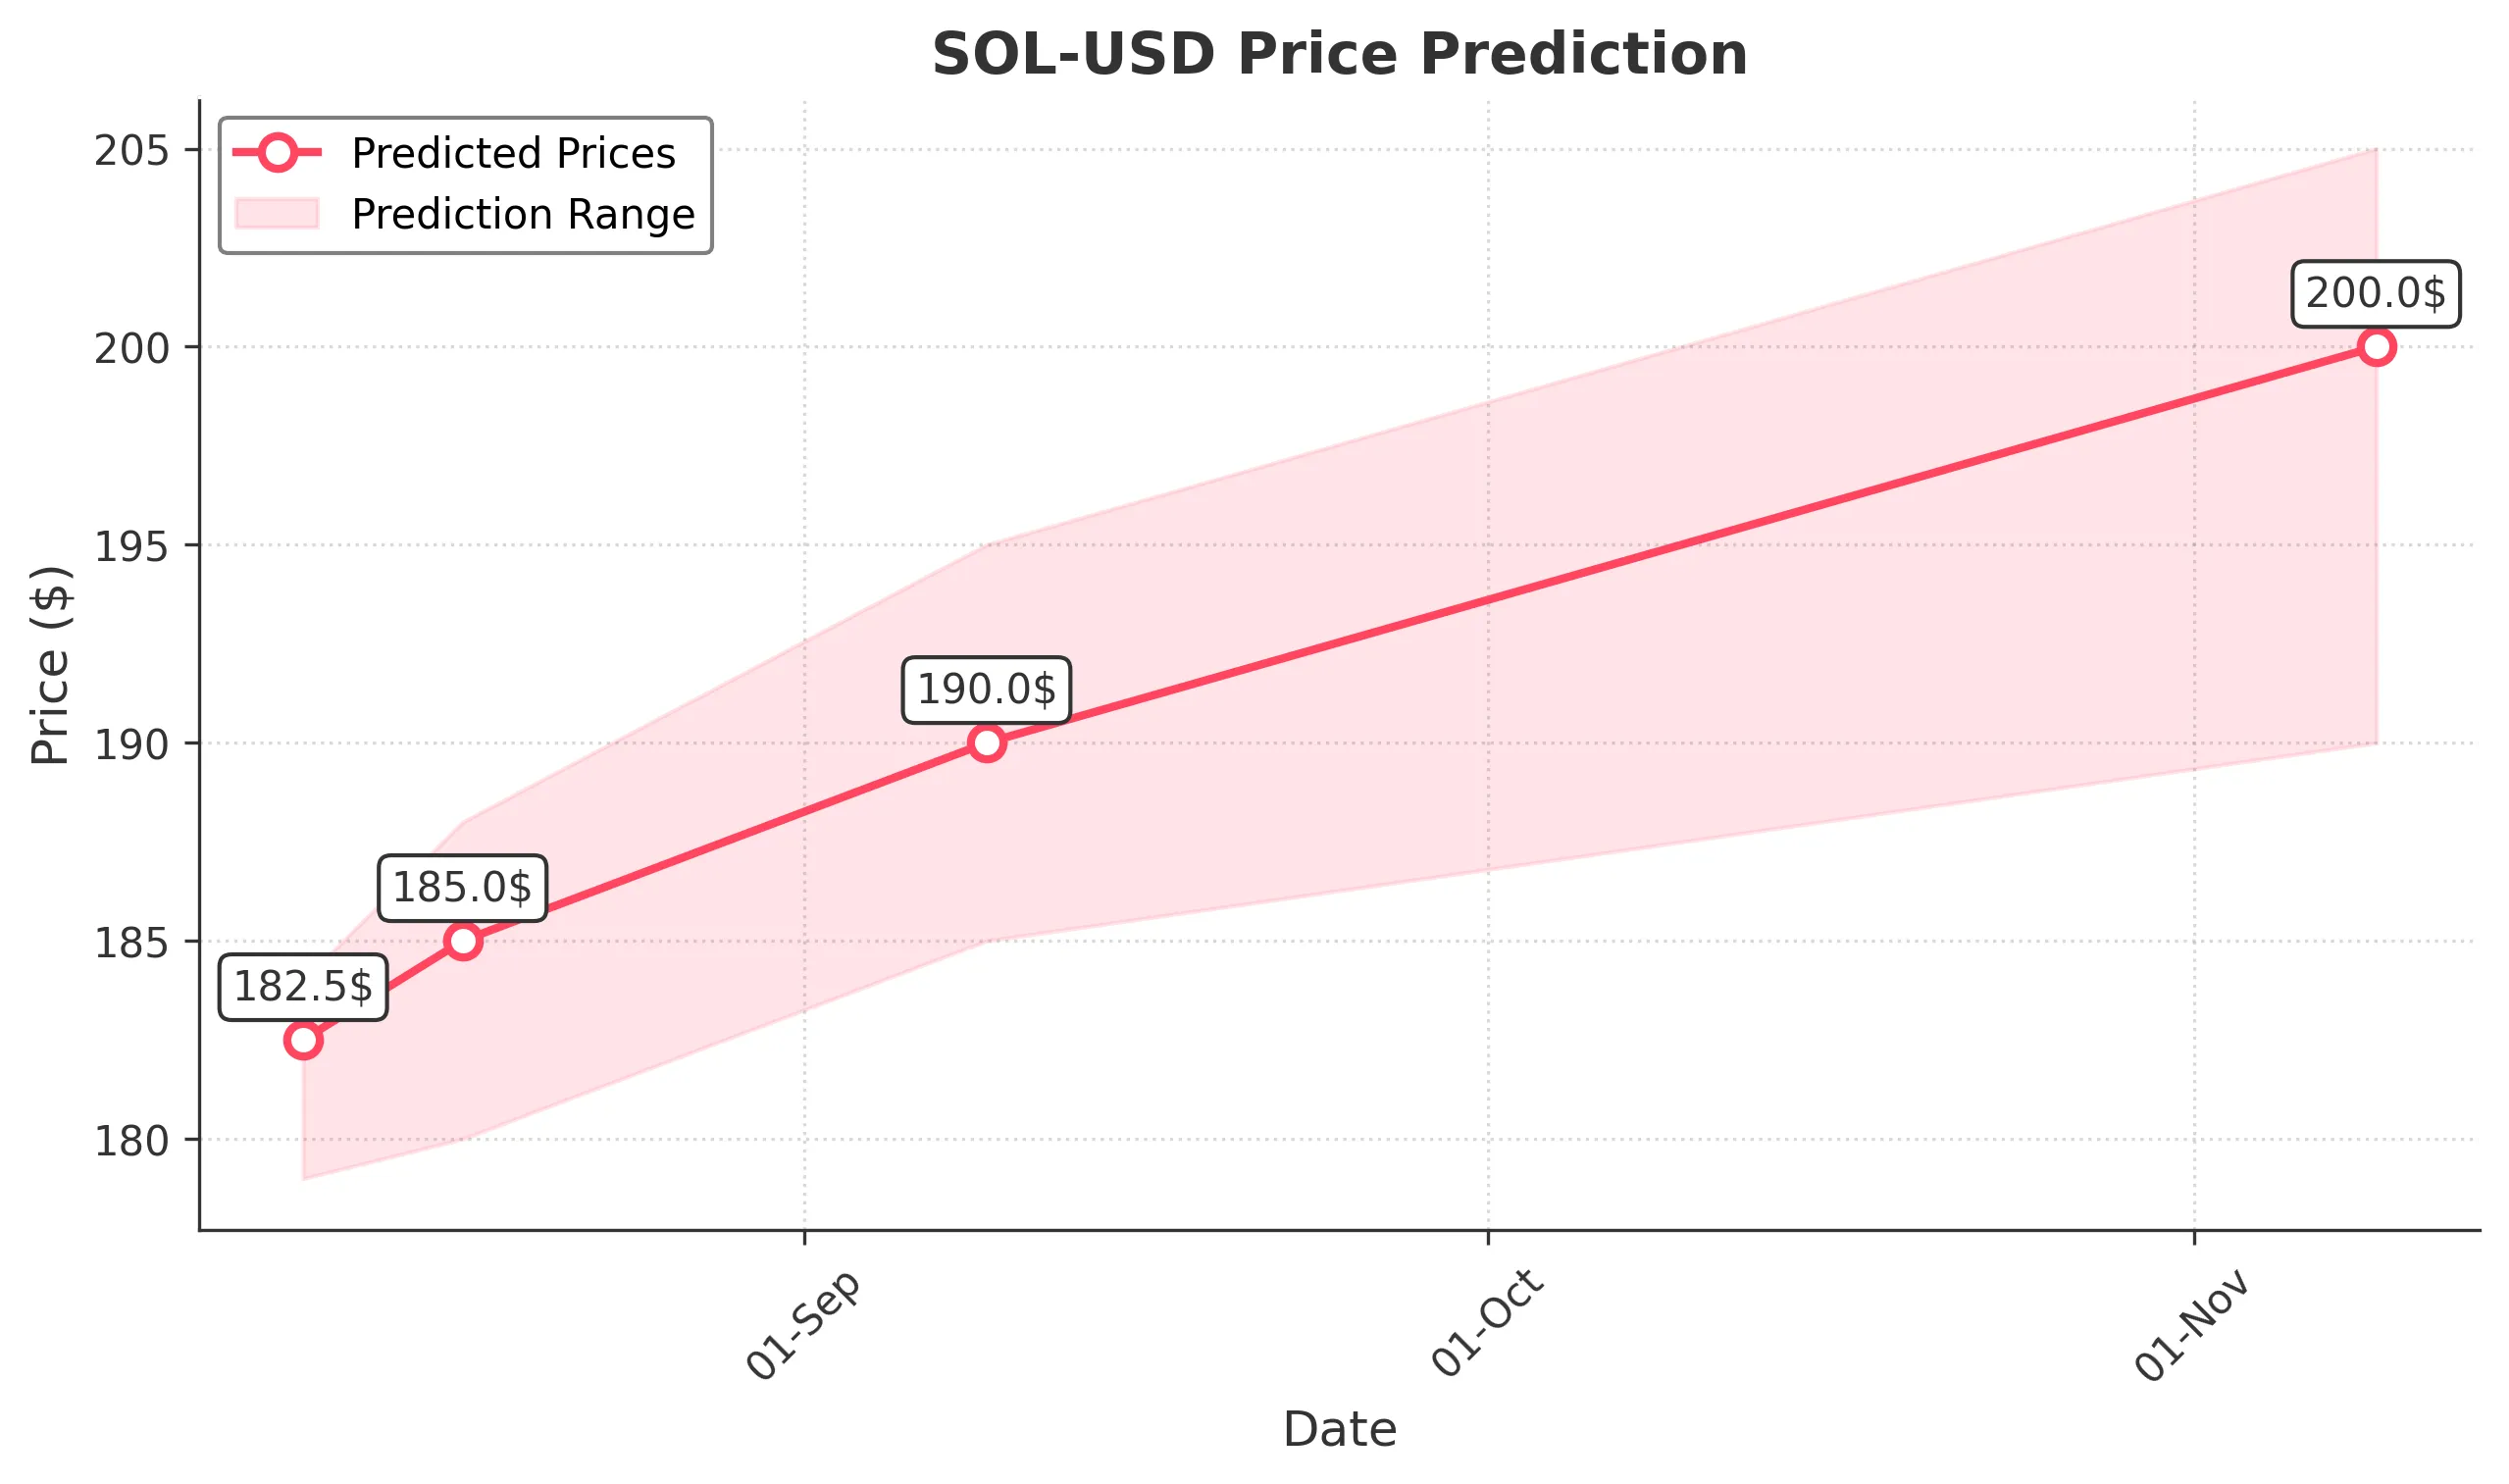
Target: August 10, 2025$182.5
$180
$184
$179
Description
The stock shows bullish momentum with a recent upward trend. The RSI is approaching overbought levels, indicating potential for a pullback. However, strong volume suggests continued interest. Expect a close around 182.5.
Analysis
Over the past 3 months, SOL-USD has shown a bullish trend with significant price increases. Key resistance at 185. Recent volume spikes indicate strong buying interest. However, the RSI nearing overbought levels suggests caution.
Confidence Level
Potential Risks
Potential for a pullback due to overbought RSI. Market sentiment could shift quickly.
1 Week Prediction
Target: August 17, 2025$185
$182
$188
$180
Description
The upward trend is expected to continue, supported by strong volume and bullish candlestick patterns. However, the market may face resistance around 188. A close at 185 indicates sustained interest.
Analysis
The stock has been on a bullish trajectory, with significant support at 180. The MACD shows bullish momentum, but the RSI indicates potential overbought conditions. Volume remains strong, suggesting continued interest.
Confidence Level
Potential Risks
Resistance levels may cause price stagnation. Market volatility could impact predictions.
1 Month Prediction
Target: September 9, 2025$190
$186
$195
$185
Description
Expect continued bullish momentum as the stock approaches key resistance levels. The MACD remains positive, and volume trends support upward movement. A close at 190 reflects strong market sentiment.
Analysis
SOL-USD has shown a strong upward trend, with key support at 185. The Bollinger Bands indicate potential for price expansion. However, external market conditions could introduce volatility.
Confidence Level
Potential Risks
Market corrections could occur, especially if external factors influence sentiment. Watch for volatility.
3 Months Prediction
Target: November 9, 2025$200
$195
$205
$190
Description
Long-term bullish outlook as the stock breaks through resistance levels. Continued strong volume and positive market sentiment support this prediction. A close at 200 indicates sustained growth.
Analysis
The stock has shown significant growth, with key resistance at 200. The MACD and RSI indicate bullish momentum, but external factors could introduce volatility. A balanced view is necessary as market conditions evolve.
Confidence Level
Potential Risks
Market conditions can change rapidly, and external economic factors may impact performance. Watch for potential corrections.