SOL-USD Trading Predictions
1 Day Prediction
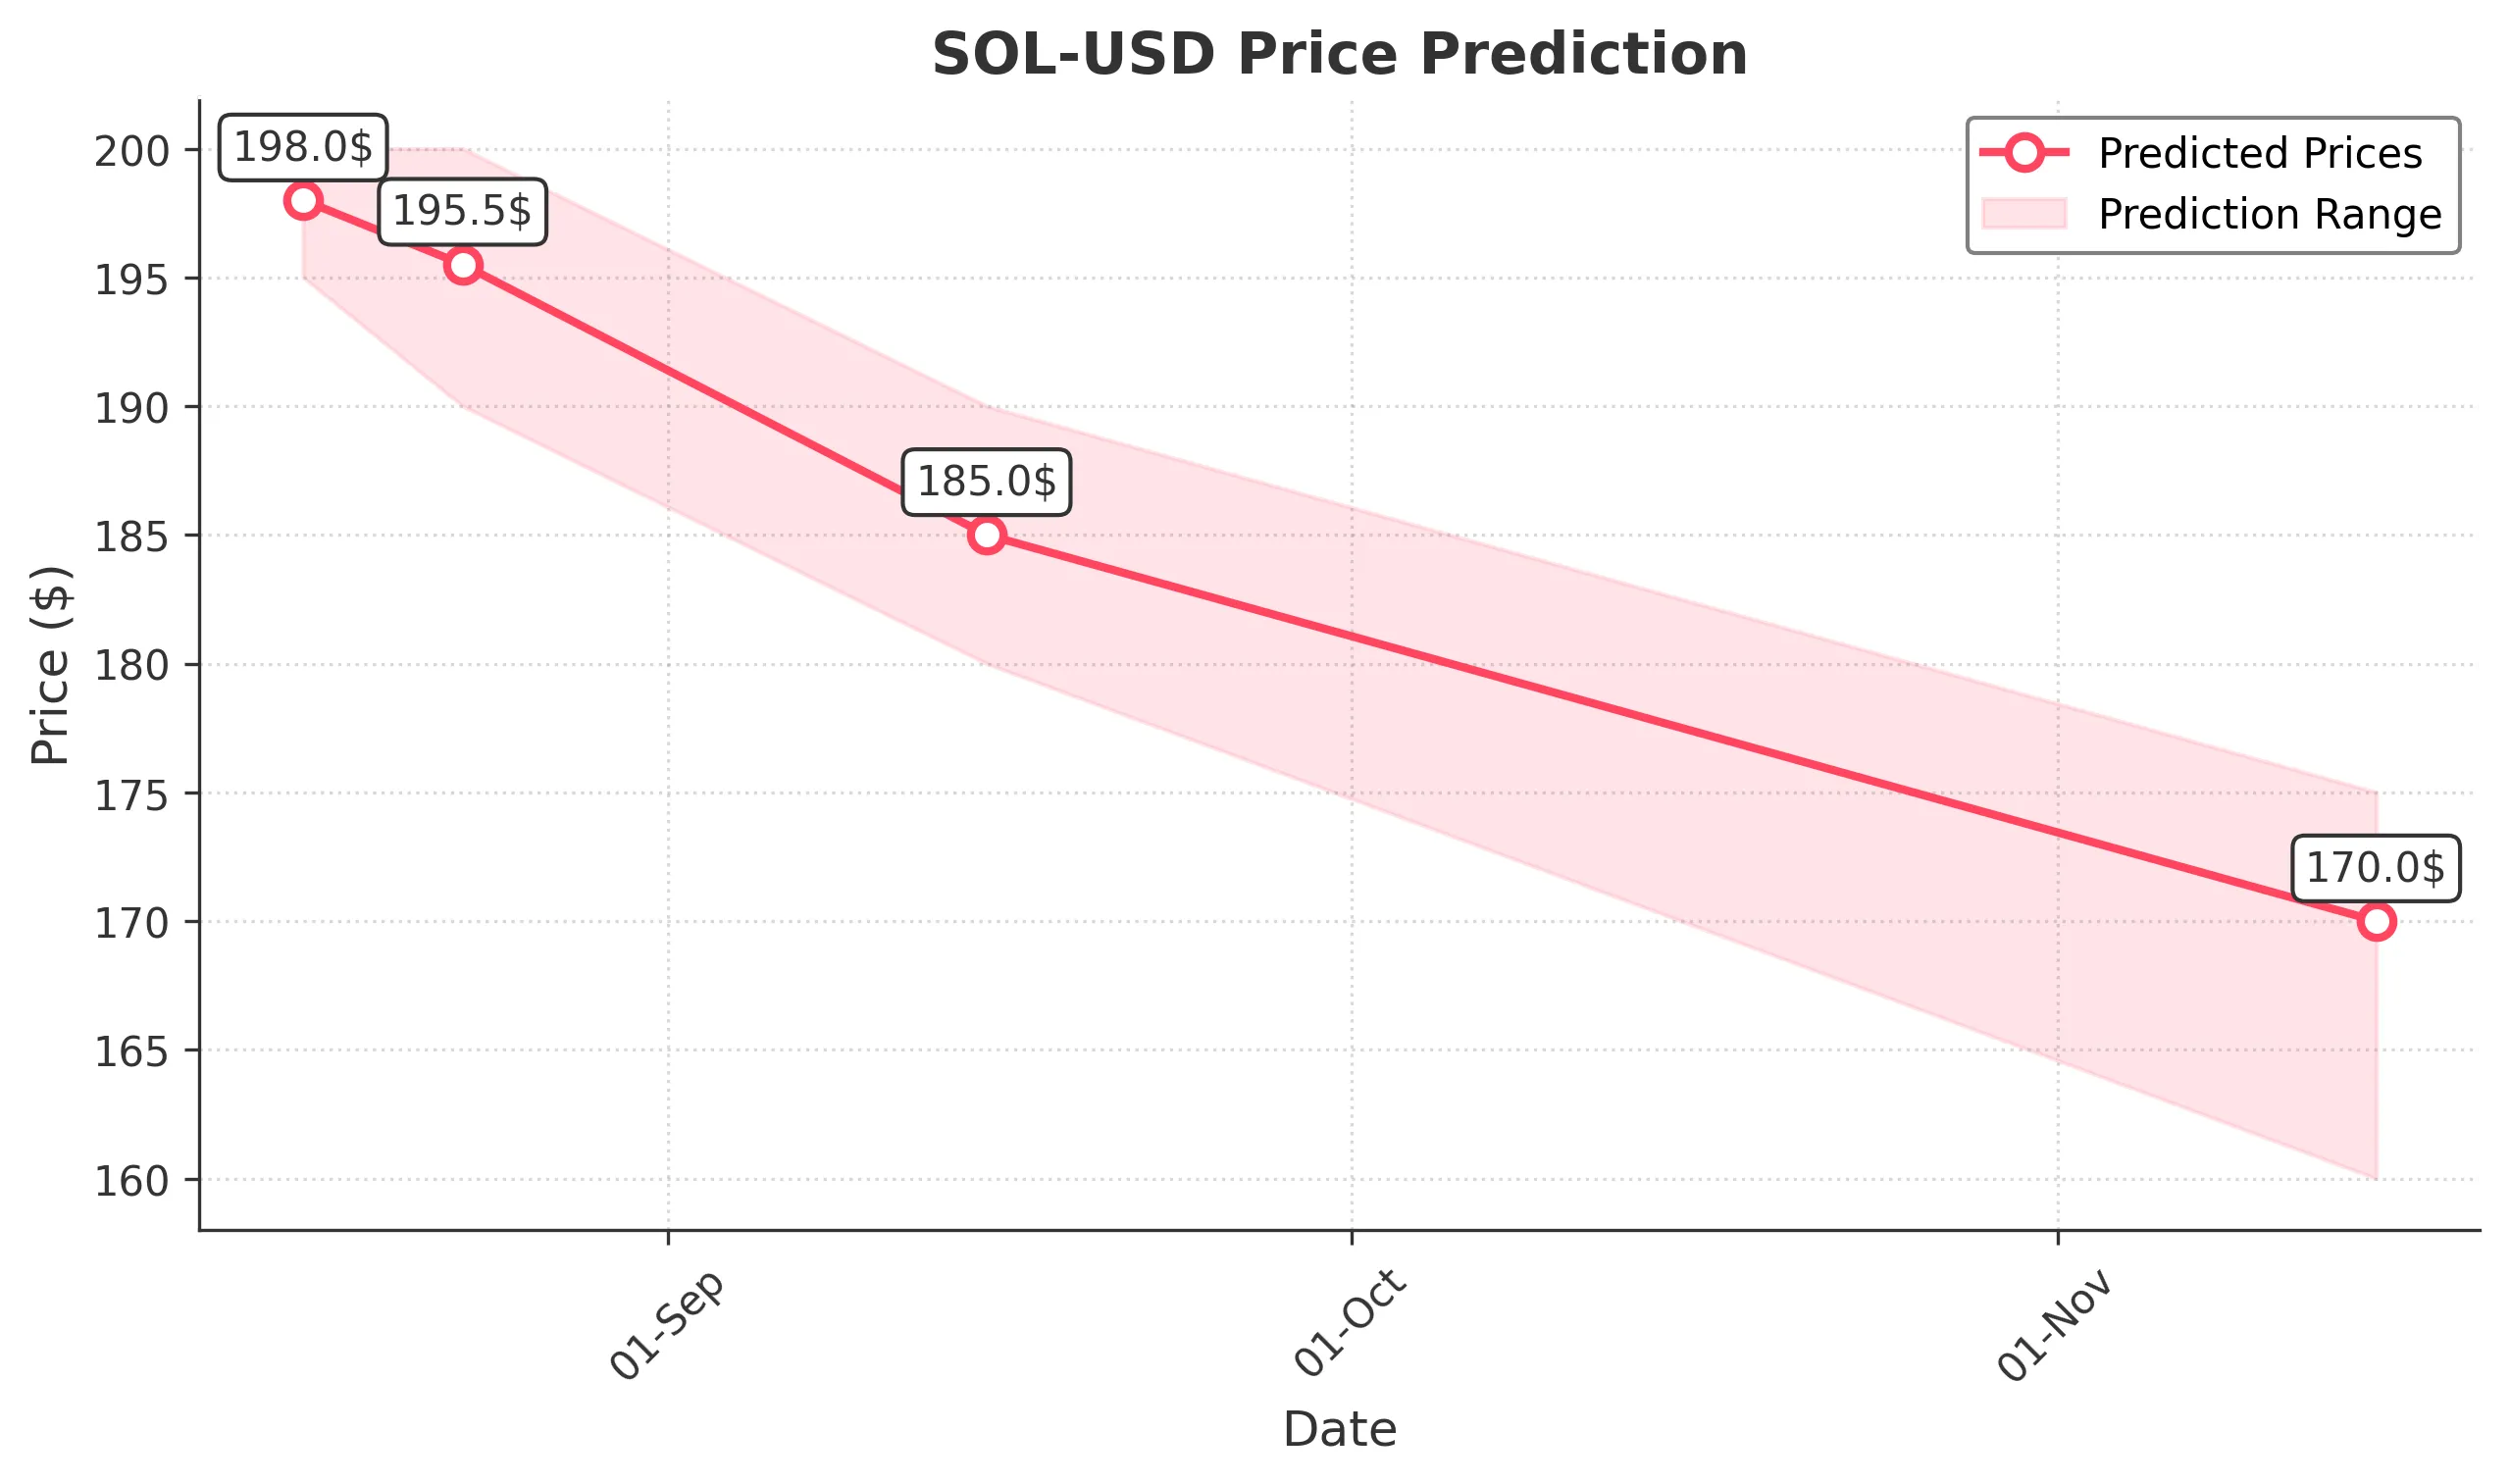
Target: August 16, 2025$198
$197
$200
$195
Description
The stock shows bullish momentum with a recent upward trend. The RSI is approaching overbought levels, indicating potential for a pullback. However, strong volume suggests continued interest. Watch for resistance at $200.
Analysis
Over the past 3 months, SOL-USD has shown a bullish trend with significant price increases. Key support at $180 and resistance at $200. Volume spikes indicate strong buying interest. Technical indicators suggest caution as RSI nears overbought.
Confidence Level
Potential Risks
Potential for a pullback due to overbought RSI. Market sentiment could shift quickly.
1 Week Prediction
Target: August 23, 2025$195.5
$198
$200
$190
Description
Expect a slight pullback as the market consolidates after recent gains. The MACD shows signs of weakening momentum. Watch for support at $190, which could hold if selling pressure increases.
Analysis
The stock has been volatile, with significant price swings. Recent highs near $200 may attract profit-taking. Key support at $190 is critical. Technical indicators suggest a potential consolidation phase.
Confidence Level
Potential Risks
Market volatility and potential profit-taking could lead to sharper declines.
1 Month Prediction
Target: September 15, 2025$185
$195.5
$190
$180
Description
A bearish trend may develop as profit-taking continues. The stock could test support levels around $180. Watch for volume trends to confirm direction.
Analysis
The stock has shown strong bullish momentum but is now facing resistance. Key support at $180 is critical. Technical indicators suggest a potential reversal, with volume patterns indicating profit-taking.
Confidence Level
Potential Risks
Uncertain macroeconomic conditions and market sentiment could impact performance.
3 Months Prediction
Target: November 15, 2025$170
$185
$175
$160
Description
Longer-term bearish sentiment may prevail as market conditions shift. A test of lower support levels is likely, with potential for further declines if macroeconomic factors worsen.
Analysis
The stock has experienced significant fluctuations. A bearish trend may develop if support levels fail. Key resistance at $185 and support at $160 are critical. Technical indicators suggest caution as market sentiment shifts.
Confidence Level
Potential Risks
Market volatility and external economic factors could lead to unexpected price movements.