SOL-USD Trading Predictions
1 Day Prediction
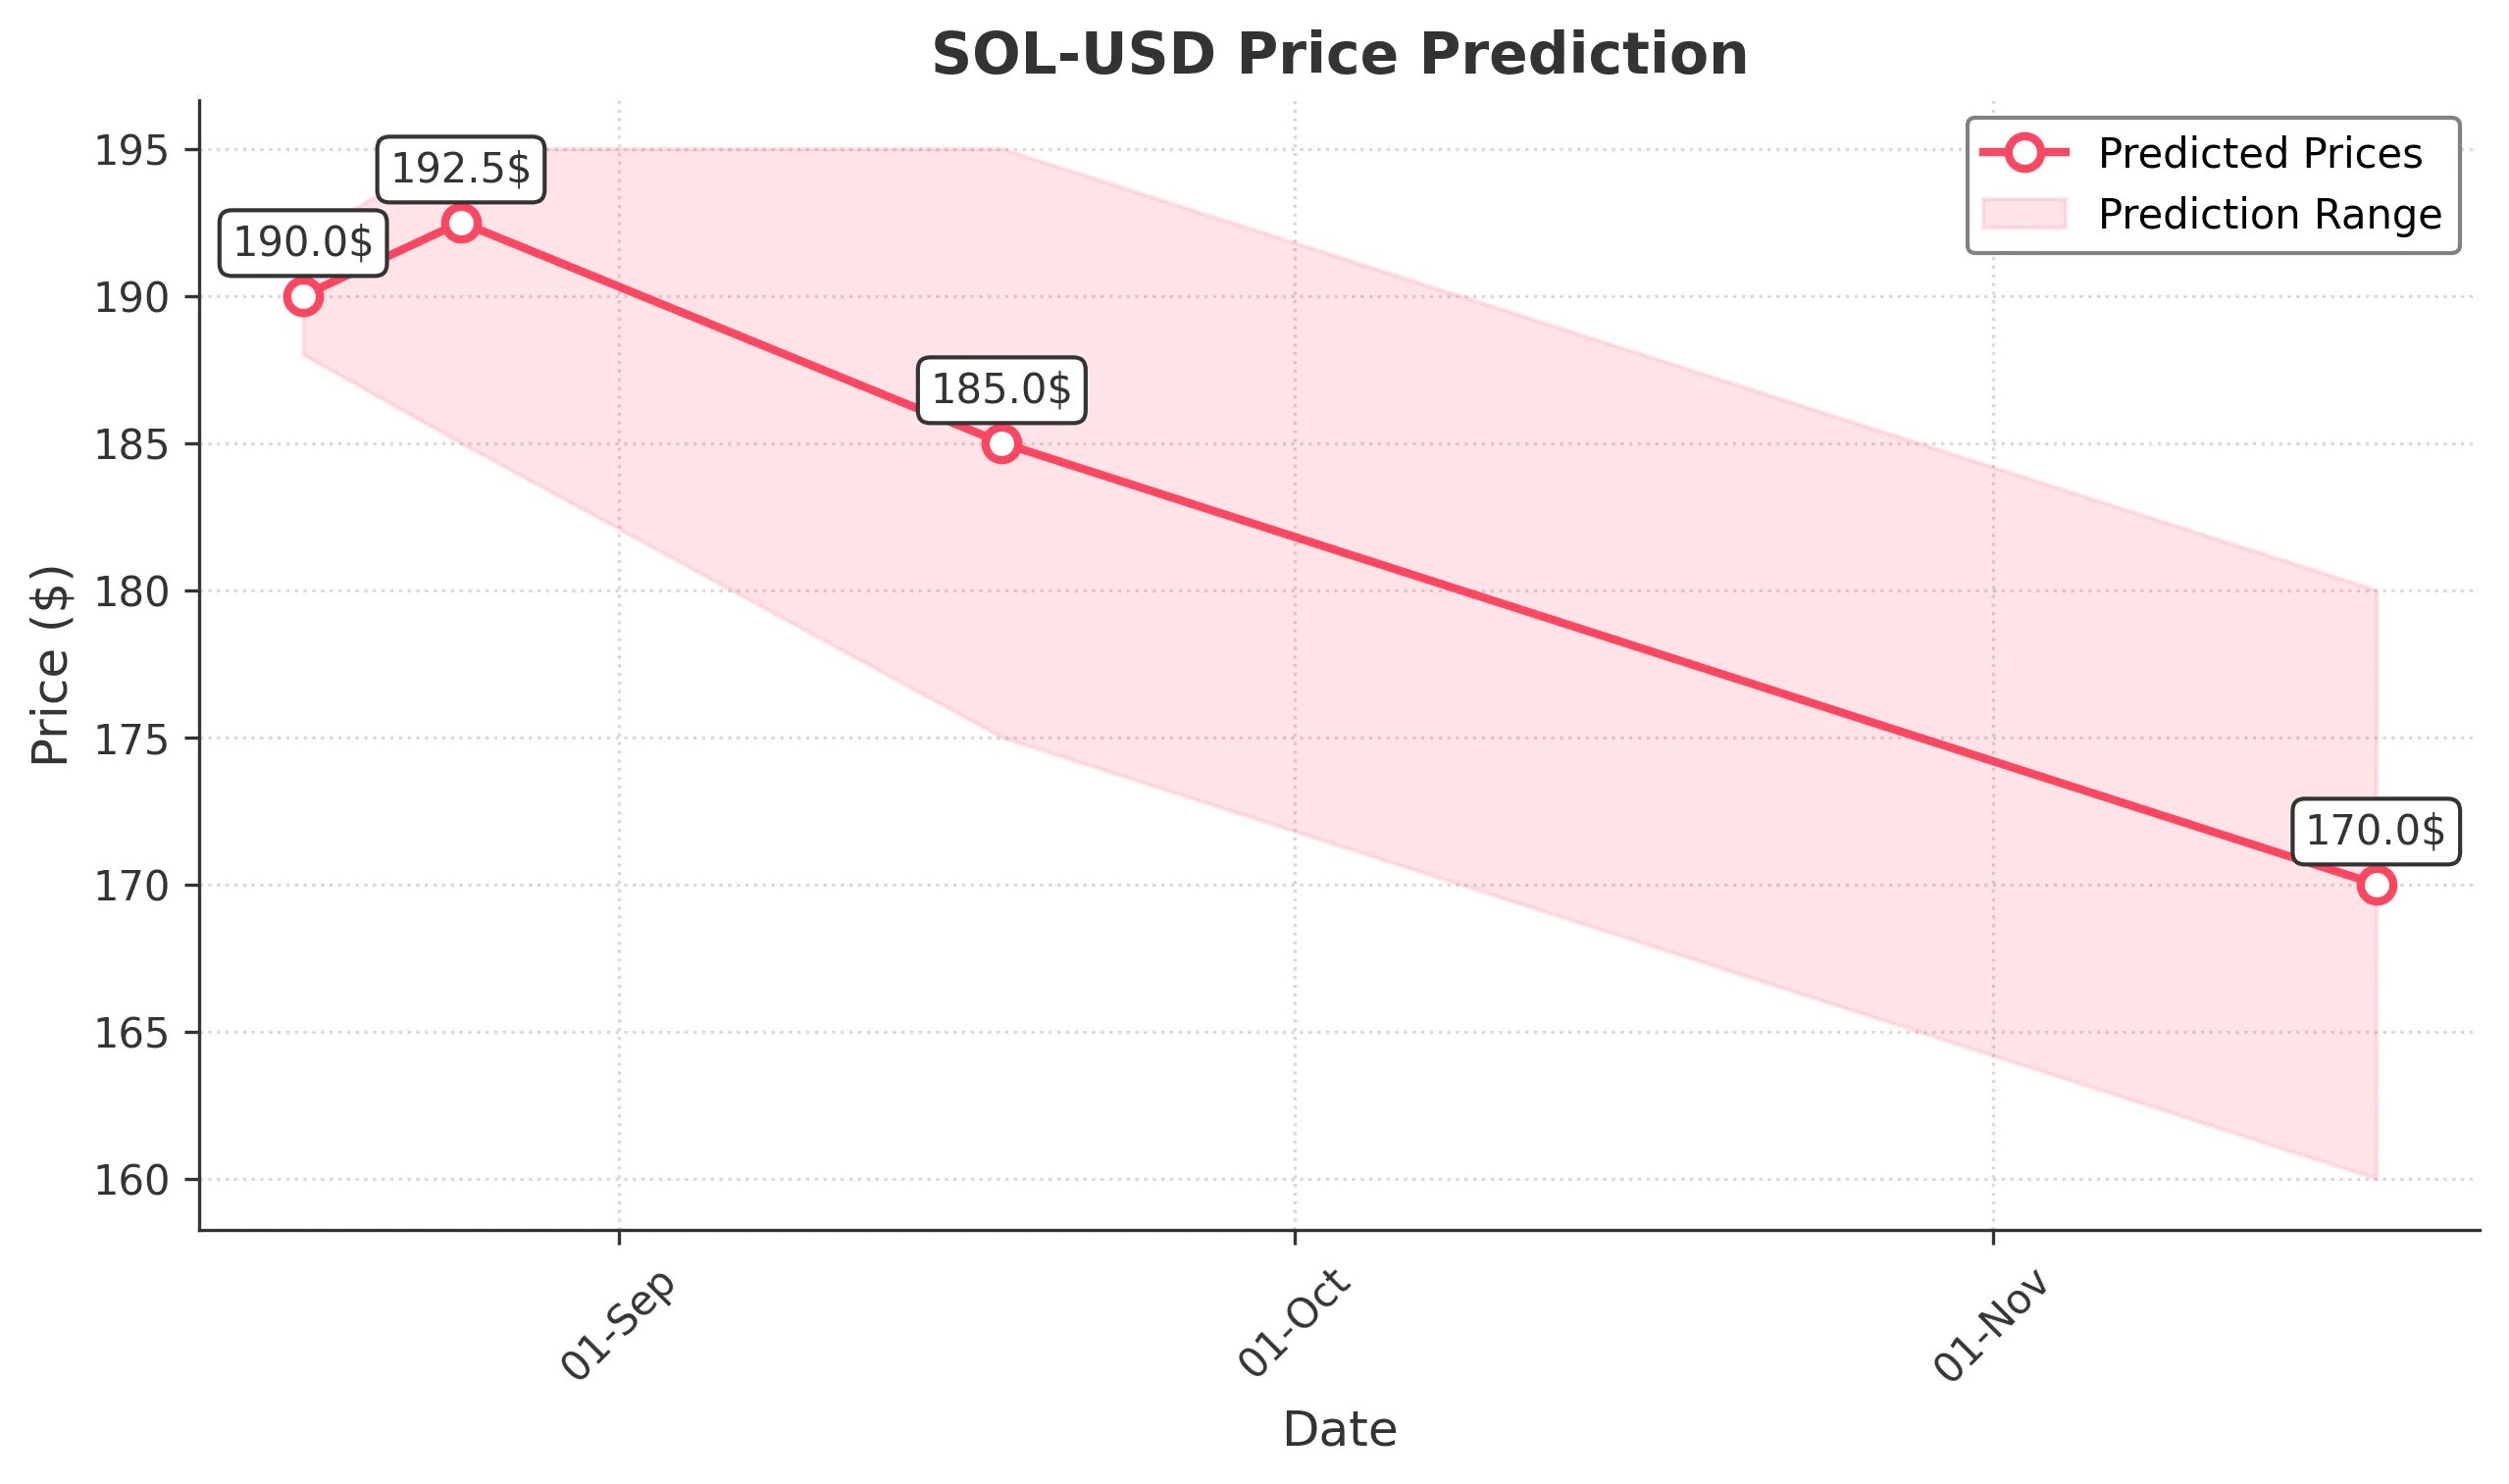
Target: August 18, 2025$190
$189.5
$192
$188
Description
The stock shows bullish momentum with a recent upward trend. The RSI is approaching overbought levels, indicating potential for a pullback. However, strong volume suggests continued interest. Expect a close around 190.0.
Analysis
Over the past 3 months, SOL-USD has shown a bullish trend with significant price increases. Key support at 180.0 and resistance at 200.0. Volume spikes indicate strong buying interest. Technical indicators suggest caution as RSI nears overbought.
Confidence Level
Potential Risks
Potential for a pullback if RSI exceeds overbought levels. Market sentiment may shift quickly.
1 Week Prediction
Target: August 25, 2025$192.5
$190
$195
$185
Description
The bullish trend is expected to continue, with potential for a slight pullback. The MACD shows upward momentum, but the RSI indicates overbought conditions. Anticipate a close around 192.5.
Analysis
SOL-USD has maintained a bullish trend, with significant resistance at 200.0. Recent volume spikes indicate strong buying. However, the RSI suggests caution as it approaches overbought territory, indicating potential for a pullback.
Confidence Level
Potential Risks
Market volatility and external news could impact price. Watch for reversal signals.
1 Month Prediction
Target: September 18, 2025$185
$190
$195
$175
Description
Expect a correction as the market may react to overbought conditions. The Fibonacci retracement levels suggest support around 180.0. Anticipate a close around 185.0.
Analysis
The stock has shown strong bullish momentum, but the RSI indicates overbought conditions. Key support at 180.0 and resistance at 200.0. Volume patterns suggest potential for a correction as traders take profits.
Confidence Level
Potential Risks
Market sentiment could shift due to macroeconomic factors. Watch for bearish signals.
3 Months Prediction
Target: November 18, 2025$170
$175
$180
$160
Description
A bearish trend may develop as profit-taking occurs. The MACD shows signs of divergence, indicating potential weakness. Expect a close around 170.0.
Analysis
The stock has experienced significant volatility, with a potential shift to a bearish trend. Key support at 160.0 and resistance at 180.0. Volume analysis indicates profit-taking, and technical indicators suggest caution as momentum wanes.
Confidence Level
Potential Risks
Unforeseen macroeconomic events could impact the market significantly. Watch for reversal patterns.