TSLA Trading Predictions
1 Day Prediction
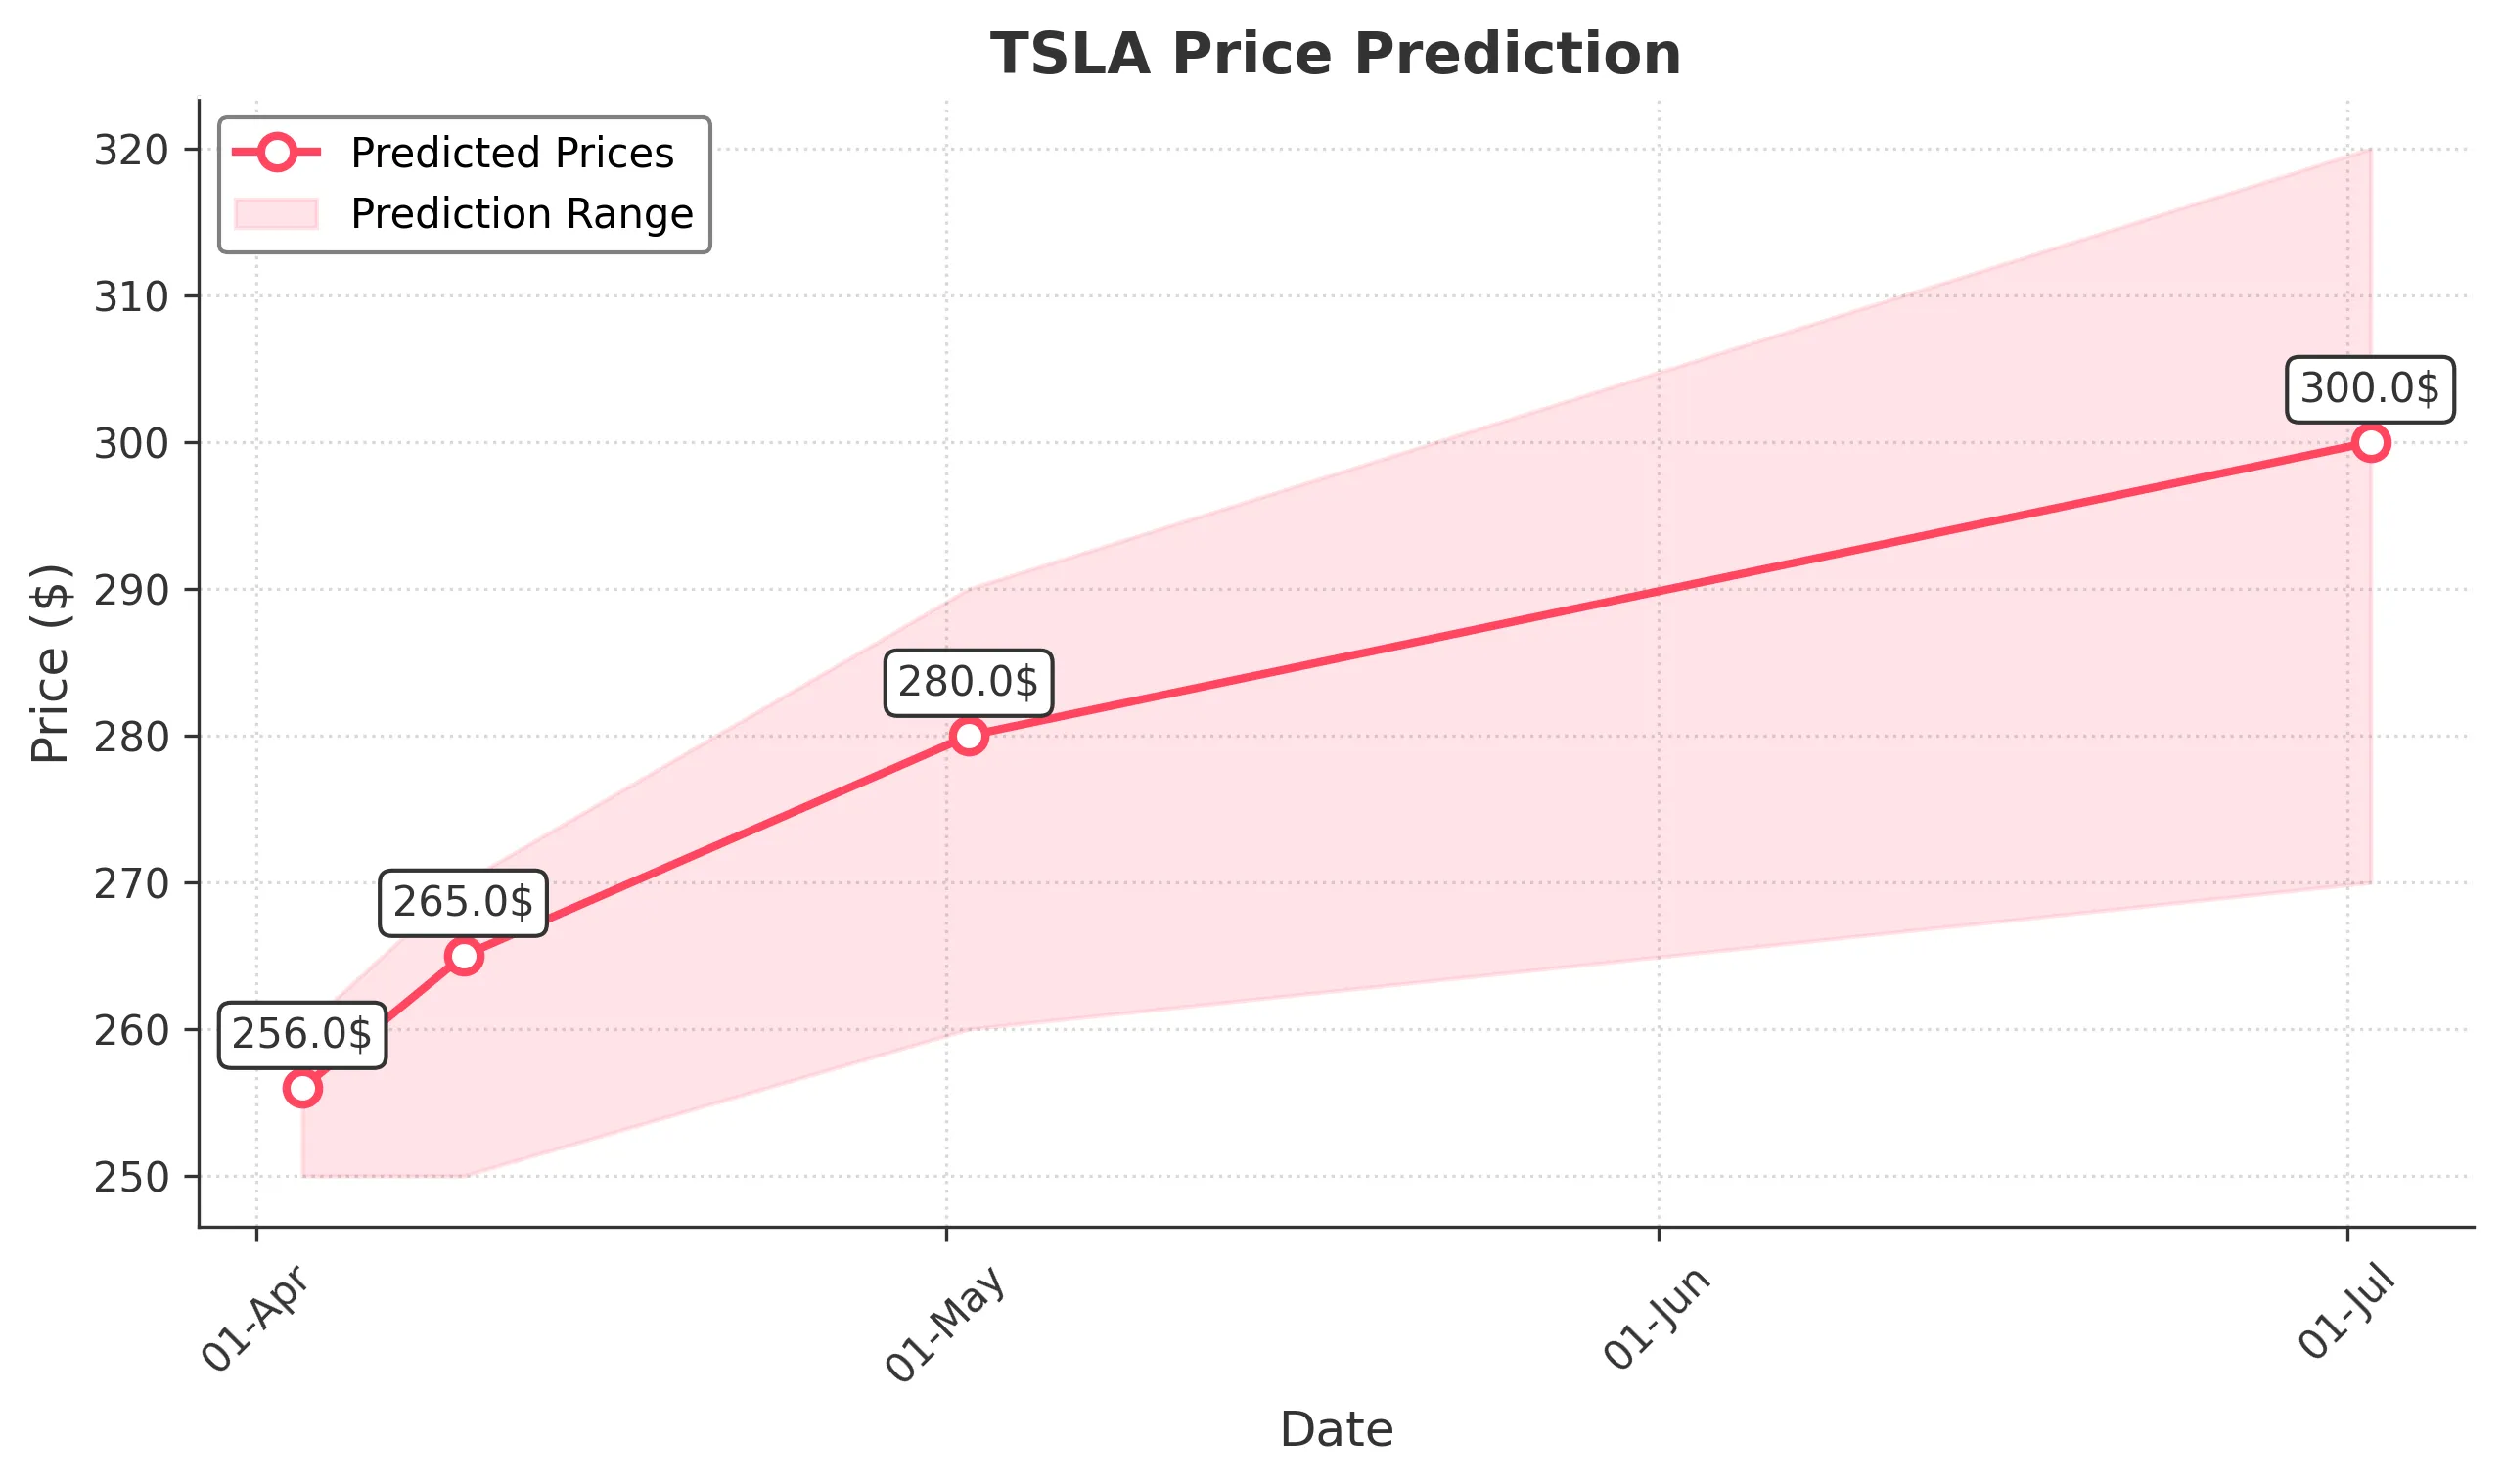
Target: April 3, 2025$256
$255
$260
$250
Description
The stock shows a slight recovery potential after recent declines, supported by a bullish divergence in the RSI. However, resistance at $260 may limit upside. Volume remains moderate, indicating cautious sentiment.
Analysis
TSLA has been in a bearish trend over the past three months, with significant support around $250. Recent candlestick patterns indicate indecision, while the RSI suggests oversold conditions. Volume spikes on down days indicate selling pressure.
Confidence Level
Potential Risks
Market volatility and external news could impact the prediction. A failure to break resistance may lead to further declines.
1 Week Prediction
Target: April 10, 2025$265
$260
$270
$250
Description
A potential rebound is expected as the stock approaches key support levels. The MACD shows signs of a bullish crossover, suggesting upward momentum. However, resistance at $270 could pose challenges.
Analysis
The stock has shown a bearish trend, with significant support at $250. Recent price action indicates a potential reversal, but the overall sentiment remains cautious. Technical indicators suggest a possible short-term recovery.
Confidence Level
Potential Risks
Uncertainty in market sentiment and macroeconomic factors could lead to unexpected volatility, impacting the prediction.
1 Month Prediction
Target: May 2, 2025$280
$275
$290
$260
Description
If the stock can maintain momentum, a gradual recovery towards $280 is plausible. The Bollinger Bands indicate potential for upward movement, but market sentiment remains a key risk factor.
Analysis
TSLA has faced significant selling pressure, with key support at $250. The stock's performance has been volatile, and while there are signs of recovery, the overall trend remains bearish. Caution is advised.
Confidence Level
Potential Risks
Market conditions and external events could lead to further declines, especially if resistance levels hold.
3 Months Prediction
Target: July 2, 2025$300
$295
$320
$270
Description
A longer-term recovery could see TSLA reaching $300 if it breaks through resistance levels. The Fibonacci retracement levels suggest potential for upward movement, but macroeconomic factors remain a concern.
Analysis
The stock has been in a bearish phase, with significant resistance at $300. While there are signs of potential recovery, the overall market sentiment and external factors could heavily influence future performance.
Confidence Level
Potential Risks
Long-term predictions are uncertain due to potential market shifts and economic conditions that could impact stock performance.