TSLA Trading Predictions
1 Day Prediction
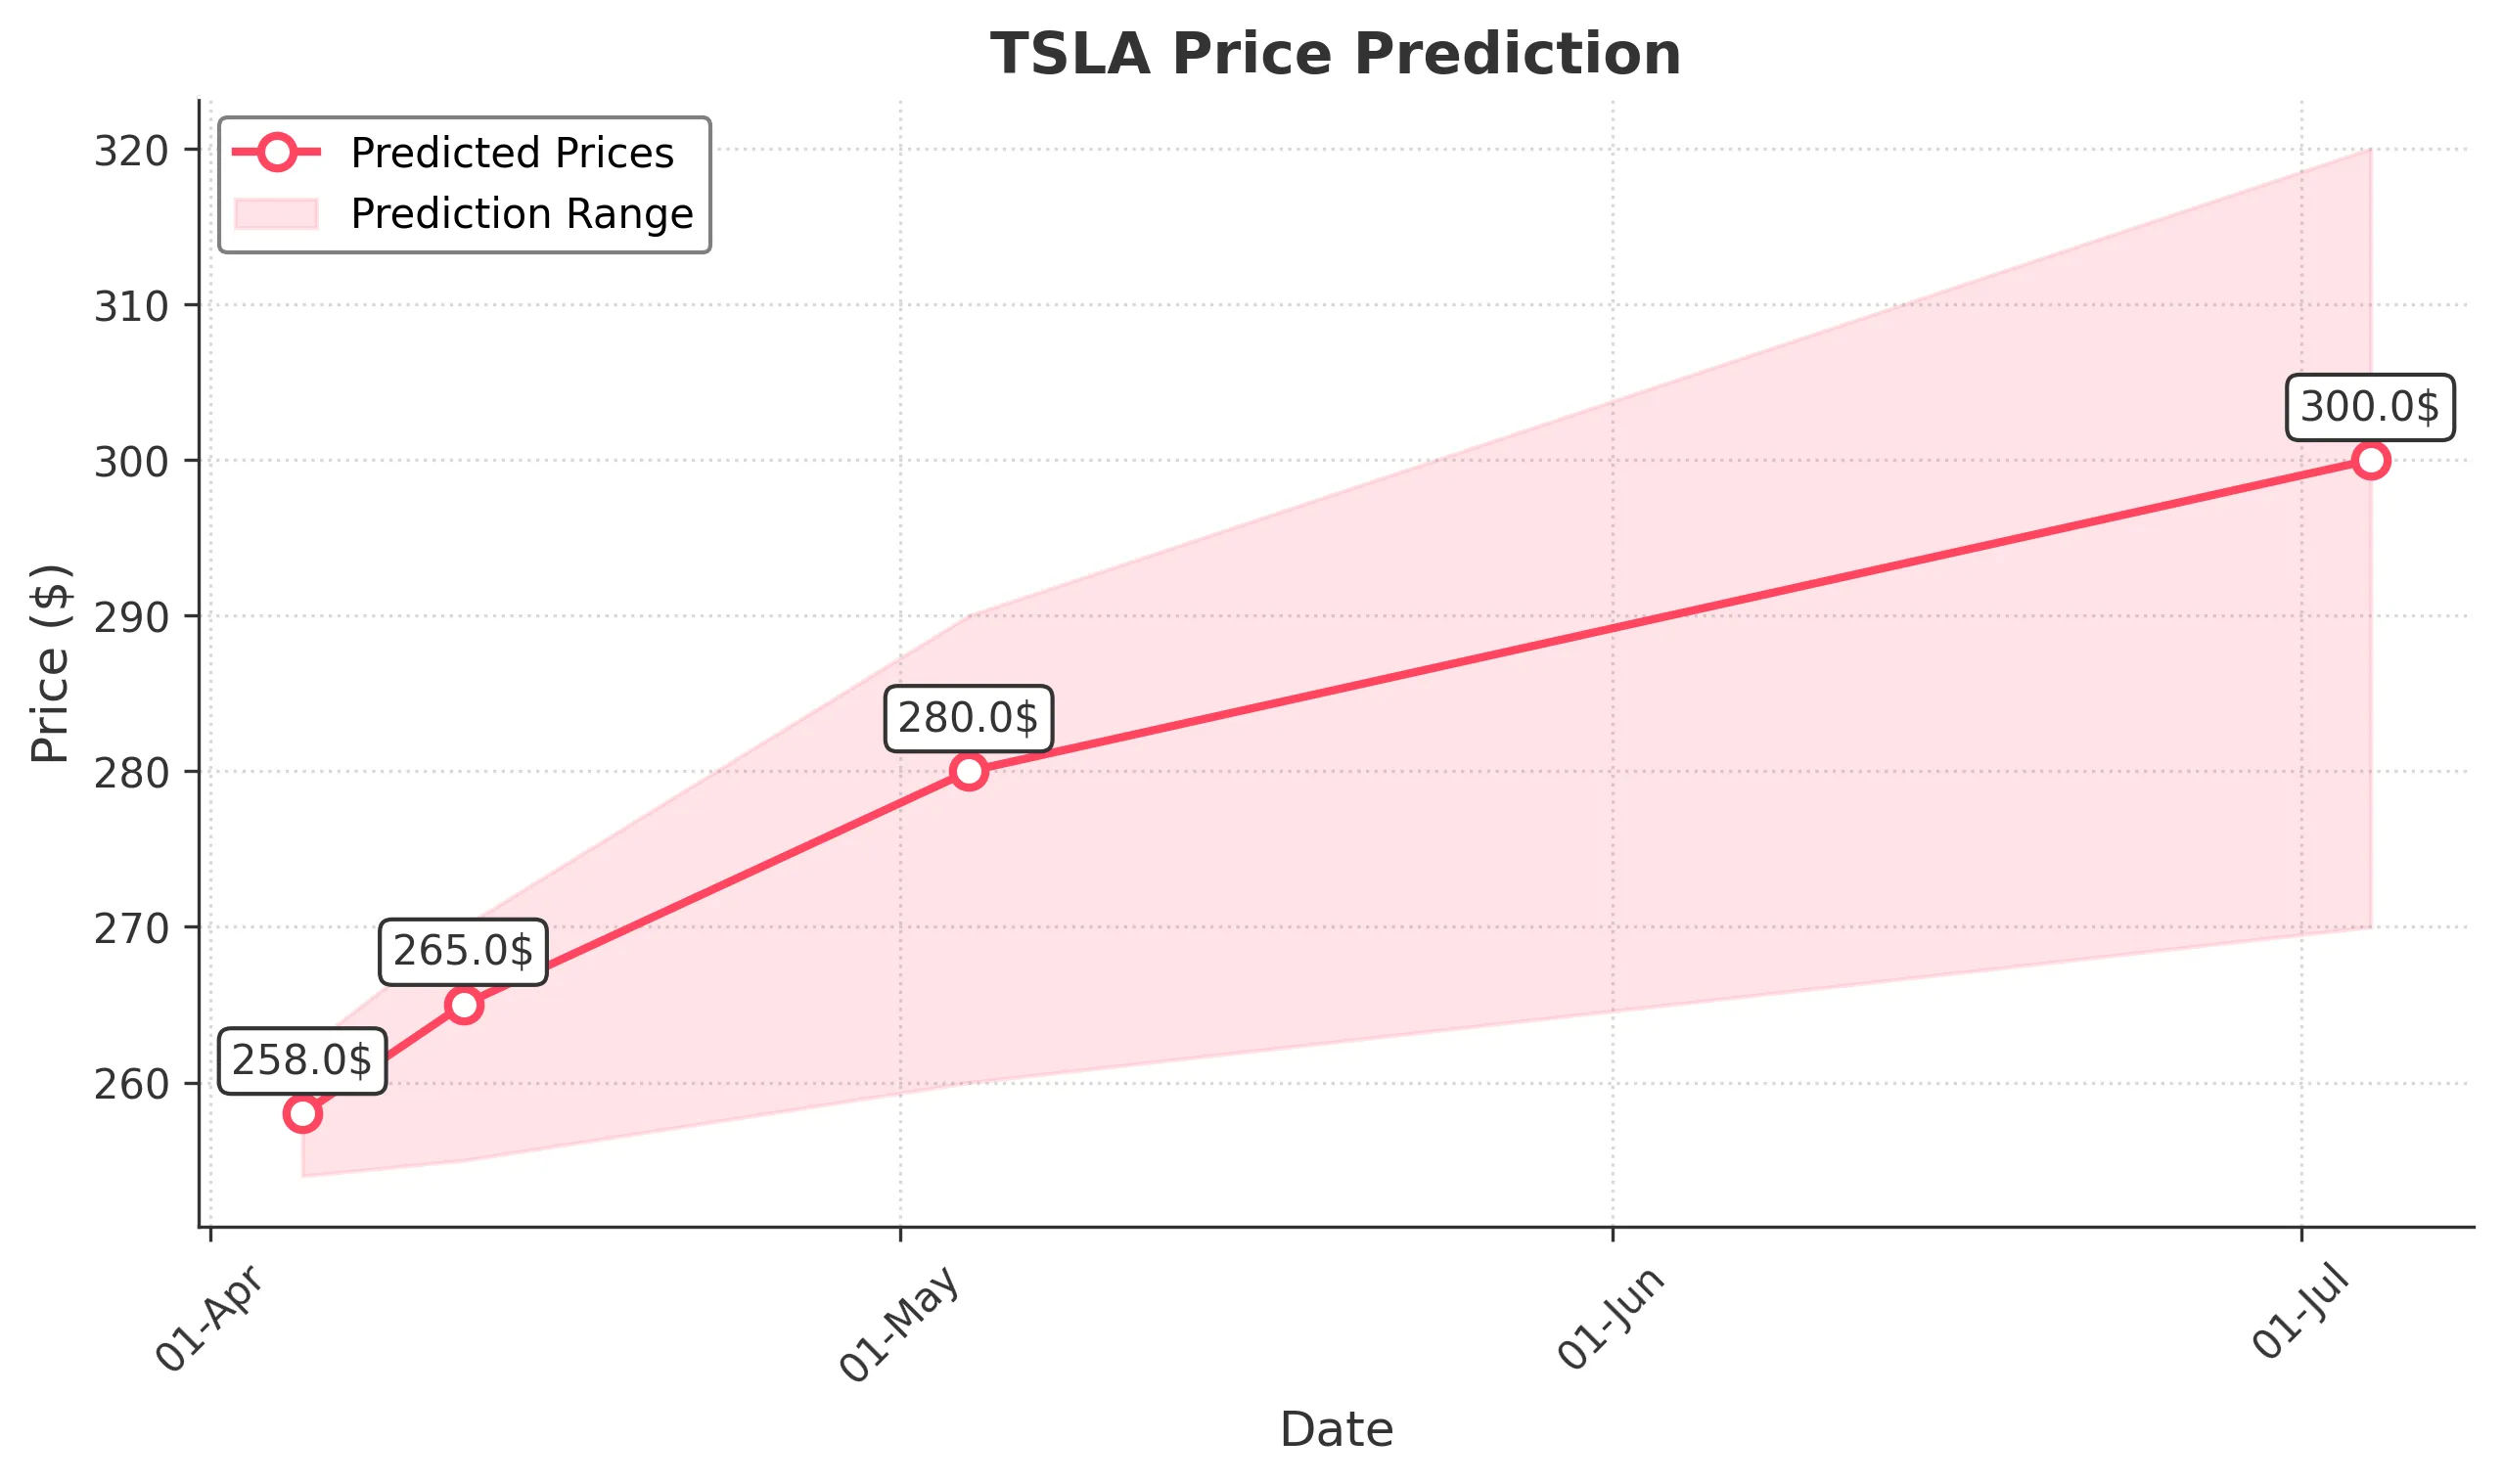
Target: April 5, 2025$258
$256
$262
$254
Description
The stock shows a slight bearish trend with recent lower closes. RSI indicates oversold conditions, suggesting a potential bounce. However, MACD is bearish, and volume spikes indicate selling pressure. Expect a close around 258.
Analysis
TSLA has been in a bearish trend over the past three months, with significant support around 250. Recent volume spikes indicate selling pressure, while RSI suggests oversold conditions. The MACD remains bearish, indicating potential further declines.
Confidence Level
Potential Risks
Market volatility and external news could impact the prediction. A reversal pattern could emerge if bullish sentiment returns.
1 Week Prediction
Target: April 12, 2025$265
$258
$270
$255
Description
A potential recovery is anticipated as the stock may find support at 250. The RSI is improving, and a bullish divergence is forming. However, MACD remains bearish, indicating caution. Expect a close around 265.
Analysis
The stock has shown signs of stabilization around 250, with potential for a bounce. However, the overall trend remains bearish, and resistance levels are significant. Volume patterns suggest cautious trading, and external factors could influence price movements.
Confidence Level
Potential Risks
Unforeseen macroeconomic events or earnings reports could lead to volatility. The bearish MACD signals caution.
1 Month Prediction
Target: May 4, 2025$280
$265
$290
$260
Description
If the stock maintains support at 250, a gradual recovery could push the price to 280. The RSI may stabilize, and bullish sentiment could return. However, macroeconomic factors remain a risk.
Analysis
The stock has been in a bearish trend, but potential support at 250 could lead to a recovery. Volume analysis shows increased selling, but if bullish sentiment returns, a gradual upward trend may develop. External factors will be crucial.
Confidence Level
Potential Risks
Market sentiment and external economic conditions could lead to unexpected volatility. The bearish trend may persist if selling pressure continues.
3 Months Prediction
Target: July 4, 2025$300
$280
$320
$270
Description
If the stock can break above resistance levels, a bullish trend may develop. The RSI could improve, and if market sentiment shifts positively, expect a close around 300.
Analysis
The stock has faced significant selling pressure, but if it can establish a base around 250, there may be potential for recovery. Resistance levels are critical, and external factors will heavily influence the stock's trajectory.
Confidence Level
Potential Risks
Long-term predictions are uncertain due to potential market volatility and economic conditions. A bearish trend could continue if selling pressure remains.