TSLA Trading Predictions
1 Day Prediction
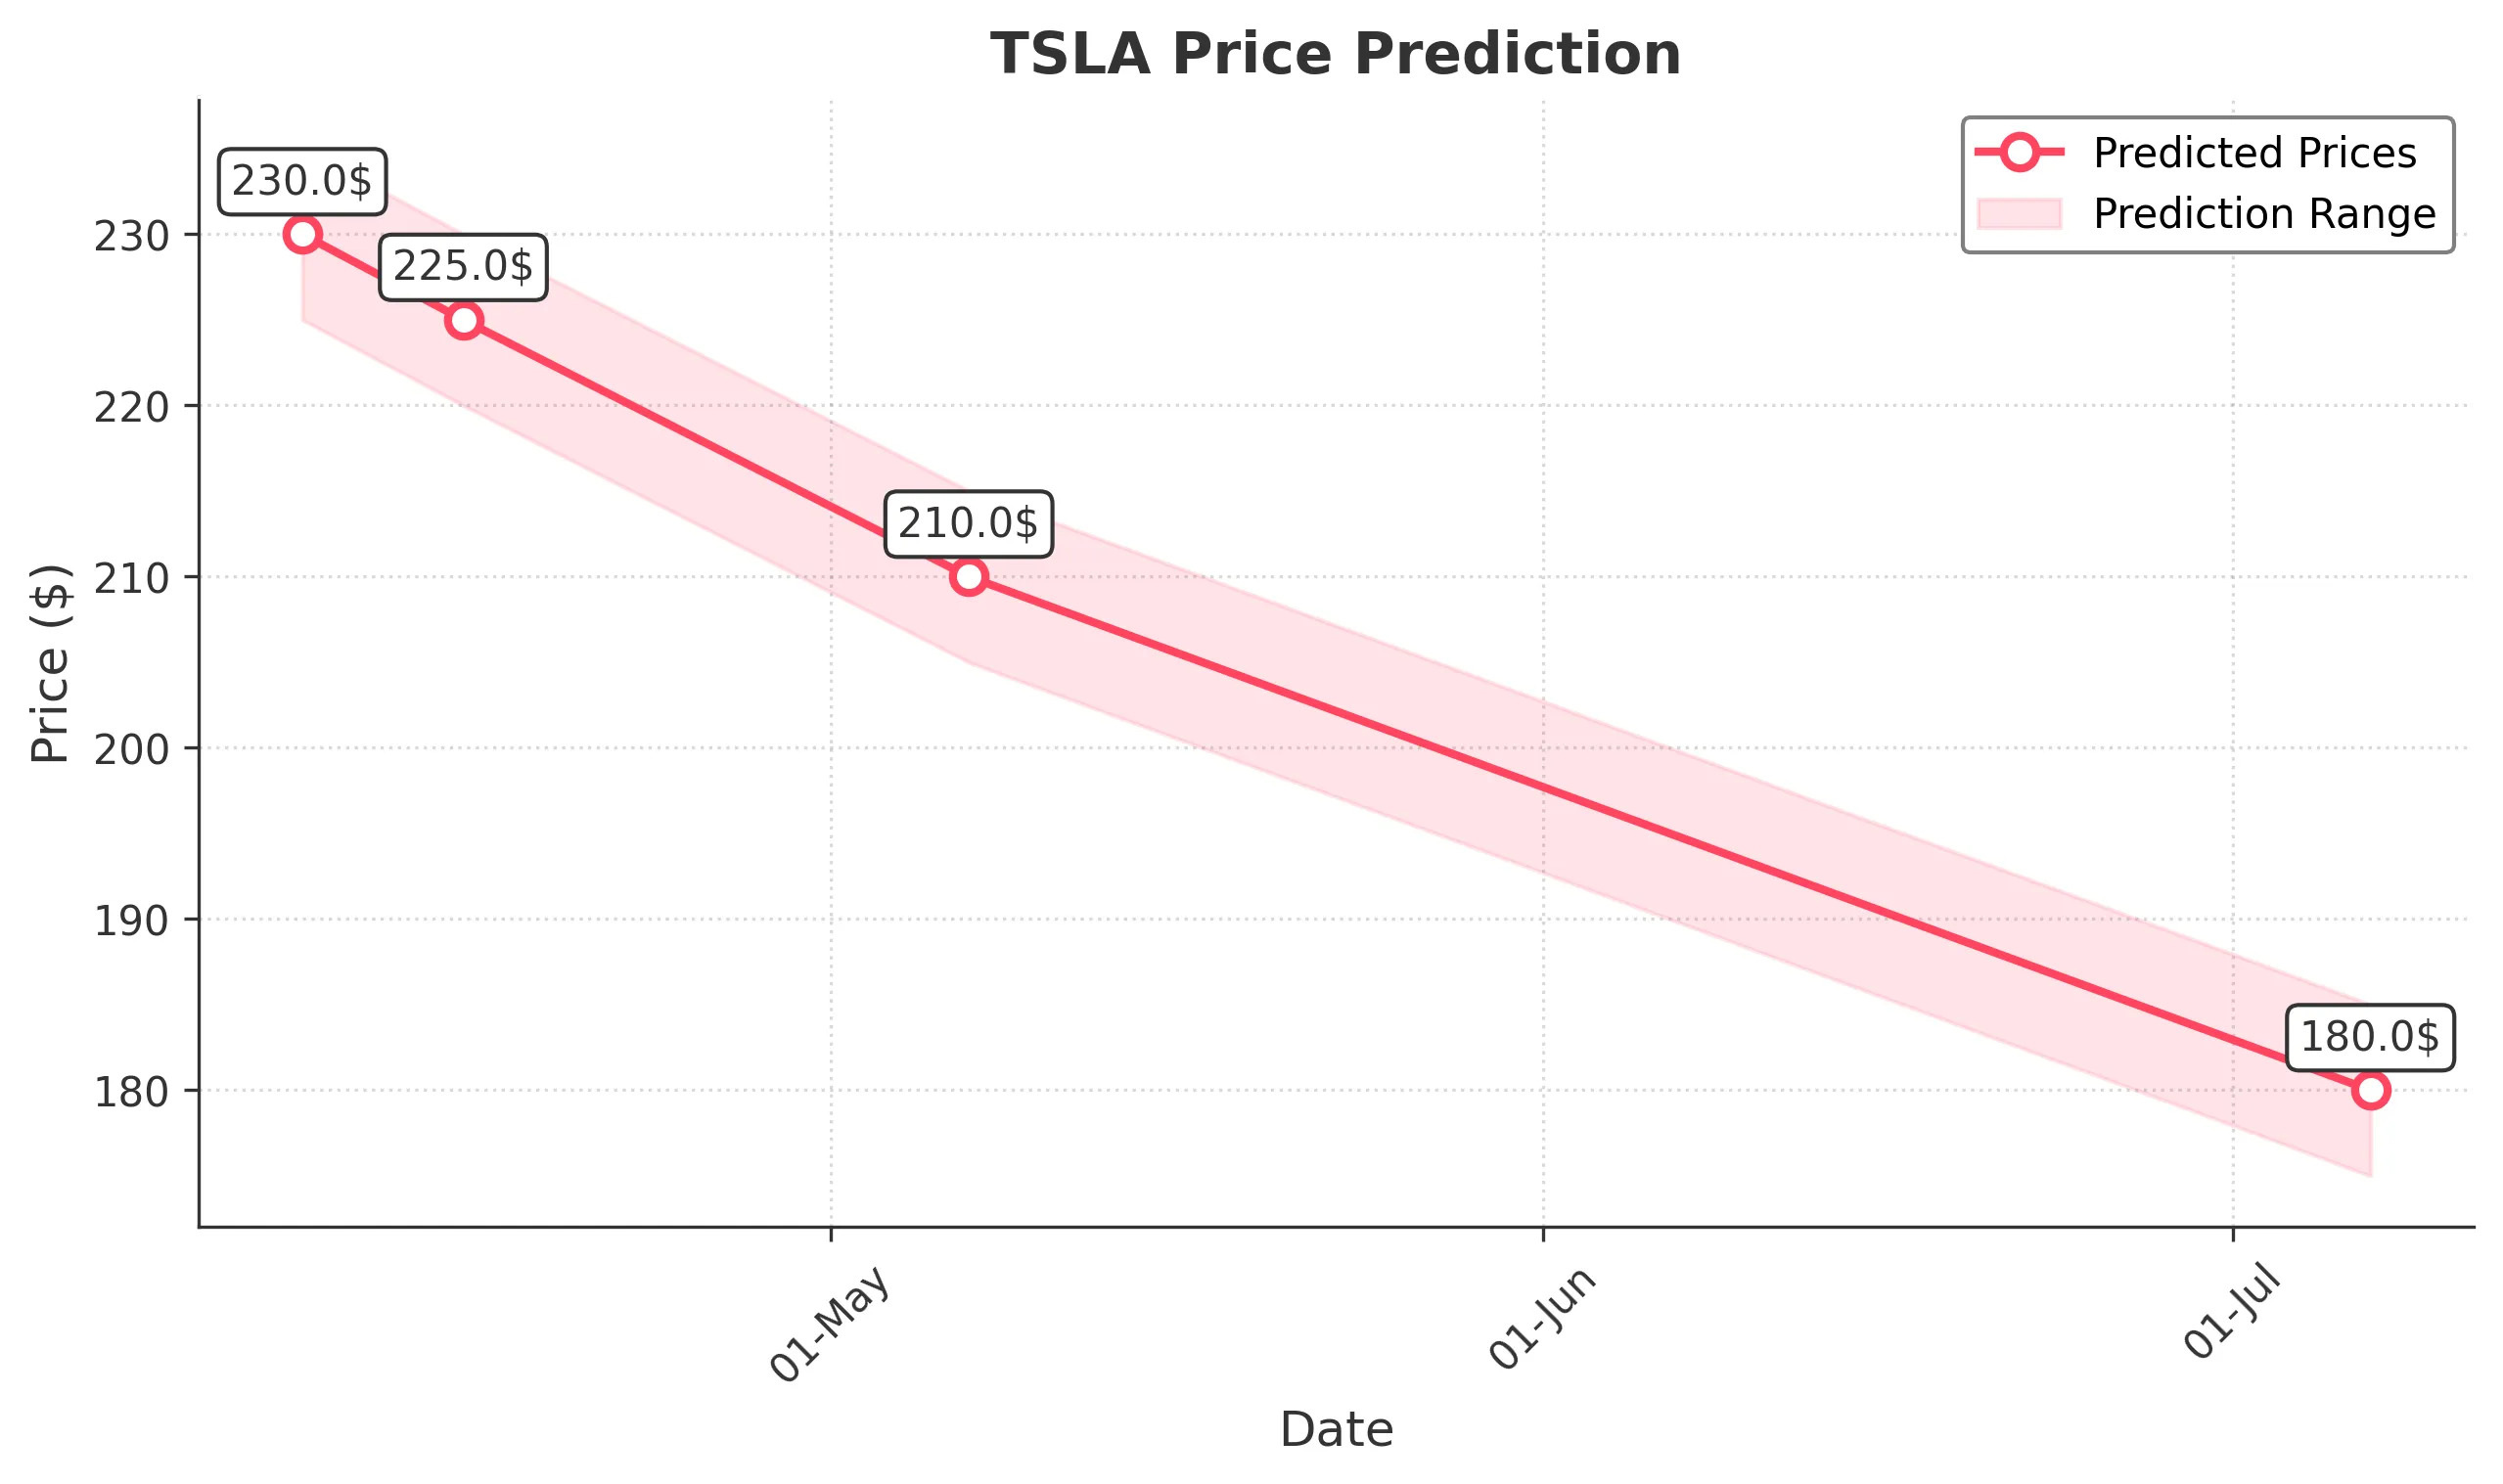
Target: April 8, 2025$230
$232
$235
$225
Description
The stock shows bearish momentum with a recent downtrend. RSI indicates oversold conditions, but MACD is bearish. Expect a slight recovery but overall weakness persists due to high selling volume.
Analysis
TSLA has been in a bearish trend over the past three months, with significant support around $220. Recent volume spikes indicate strong selling pressure. Technical indicators suggest potential for a short-term bounce, but overall sentiment is weak.
Confidence Level
Potential Risks
Market sentiment remains negative, and any unexpected news could further impact prices.
1 Week Prediction
Target: April 15, 2025$225
$230
$230
$220
Description
Continued bearish sentiment is expected, with potential for a minor recovery. However, resistance at $230 may limit upward movement. Watch for volume trends as they could indicate further declines.
Analysis
The stock has faced significant downward pressure, with key support at $220. Technical indicators like the ATR suggest increased volatility. The bearish trend is supported by high selling volume, indicating a lack of buyer confidence.
Confidence Level
Potential Risks
Unforeseen macroeconomic events or earnings reports could lead to volatility.
1 Month Prediction
Target: May 7, 2025$210
$215
$215
$205
Description
The bearish trend is likely to continue, with potential for further declines as market sentiment remains weak. Key support levels will be tested, and any negative news could exacerbate the situation.
Analysis
Over the past three months, TSLA has shown a clear downtrend, with significant resistance at $230. The stock's performance is heavily influenced by external market factors, and the overall sentiment remains bearish, suggesting further declines.
Confidence Level
Potential Risks
Market conditions are volatile, and any positive news could lead to unexpected price movements.
3 Months Prediction
Target: July 7, 2025$180
$185
$185
$175
Description
Long-term bearish outlook as the stock continues to face downward pressure. Key support levels are likely to be tested, and without significant positive catalysts, further declines are expected.
Analysis
The overall trend for TSLA is bearish, with significant resistance levels and a lack of bullish signals from technical indicators. The stock's performance is influenced by broader market conditions, and without a turnaround in sentiment, further declines are likely.
Confidence Level
Potential Risks
Long-term predictions are subject to high uncertainty due to market volatility and potential changes in investor sentiment.