TSLA Trading Predictions
1 Day Prediction
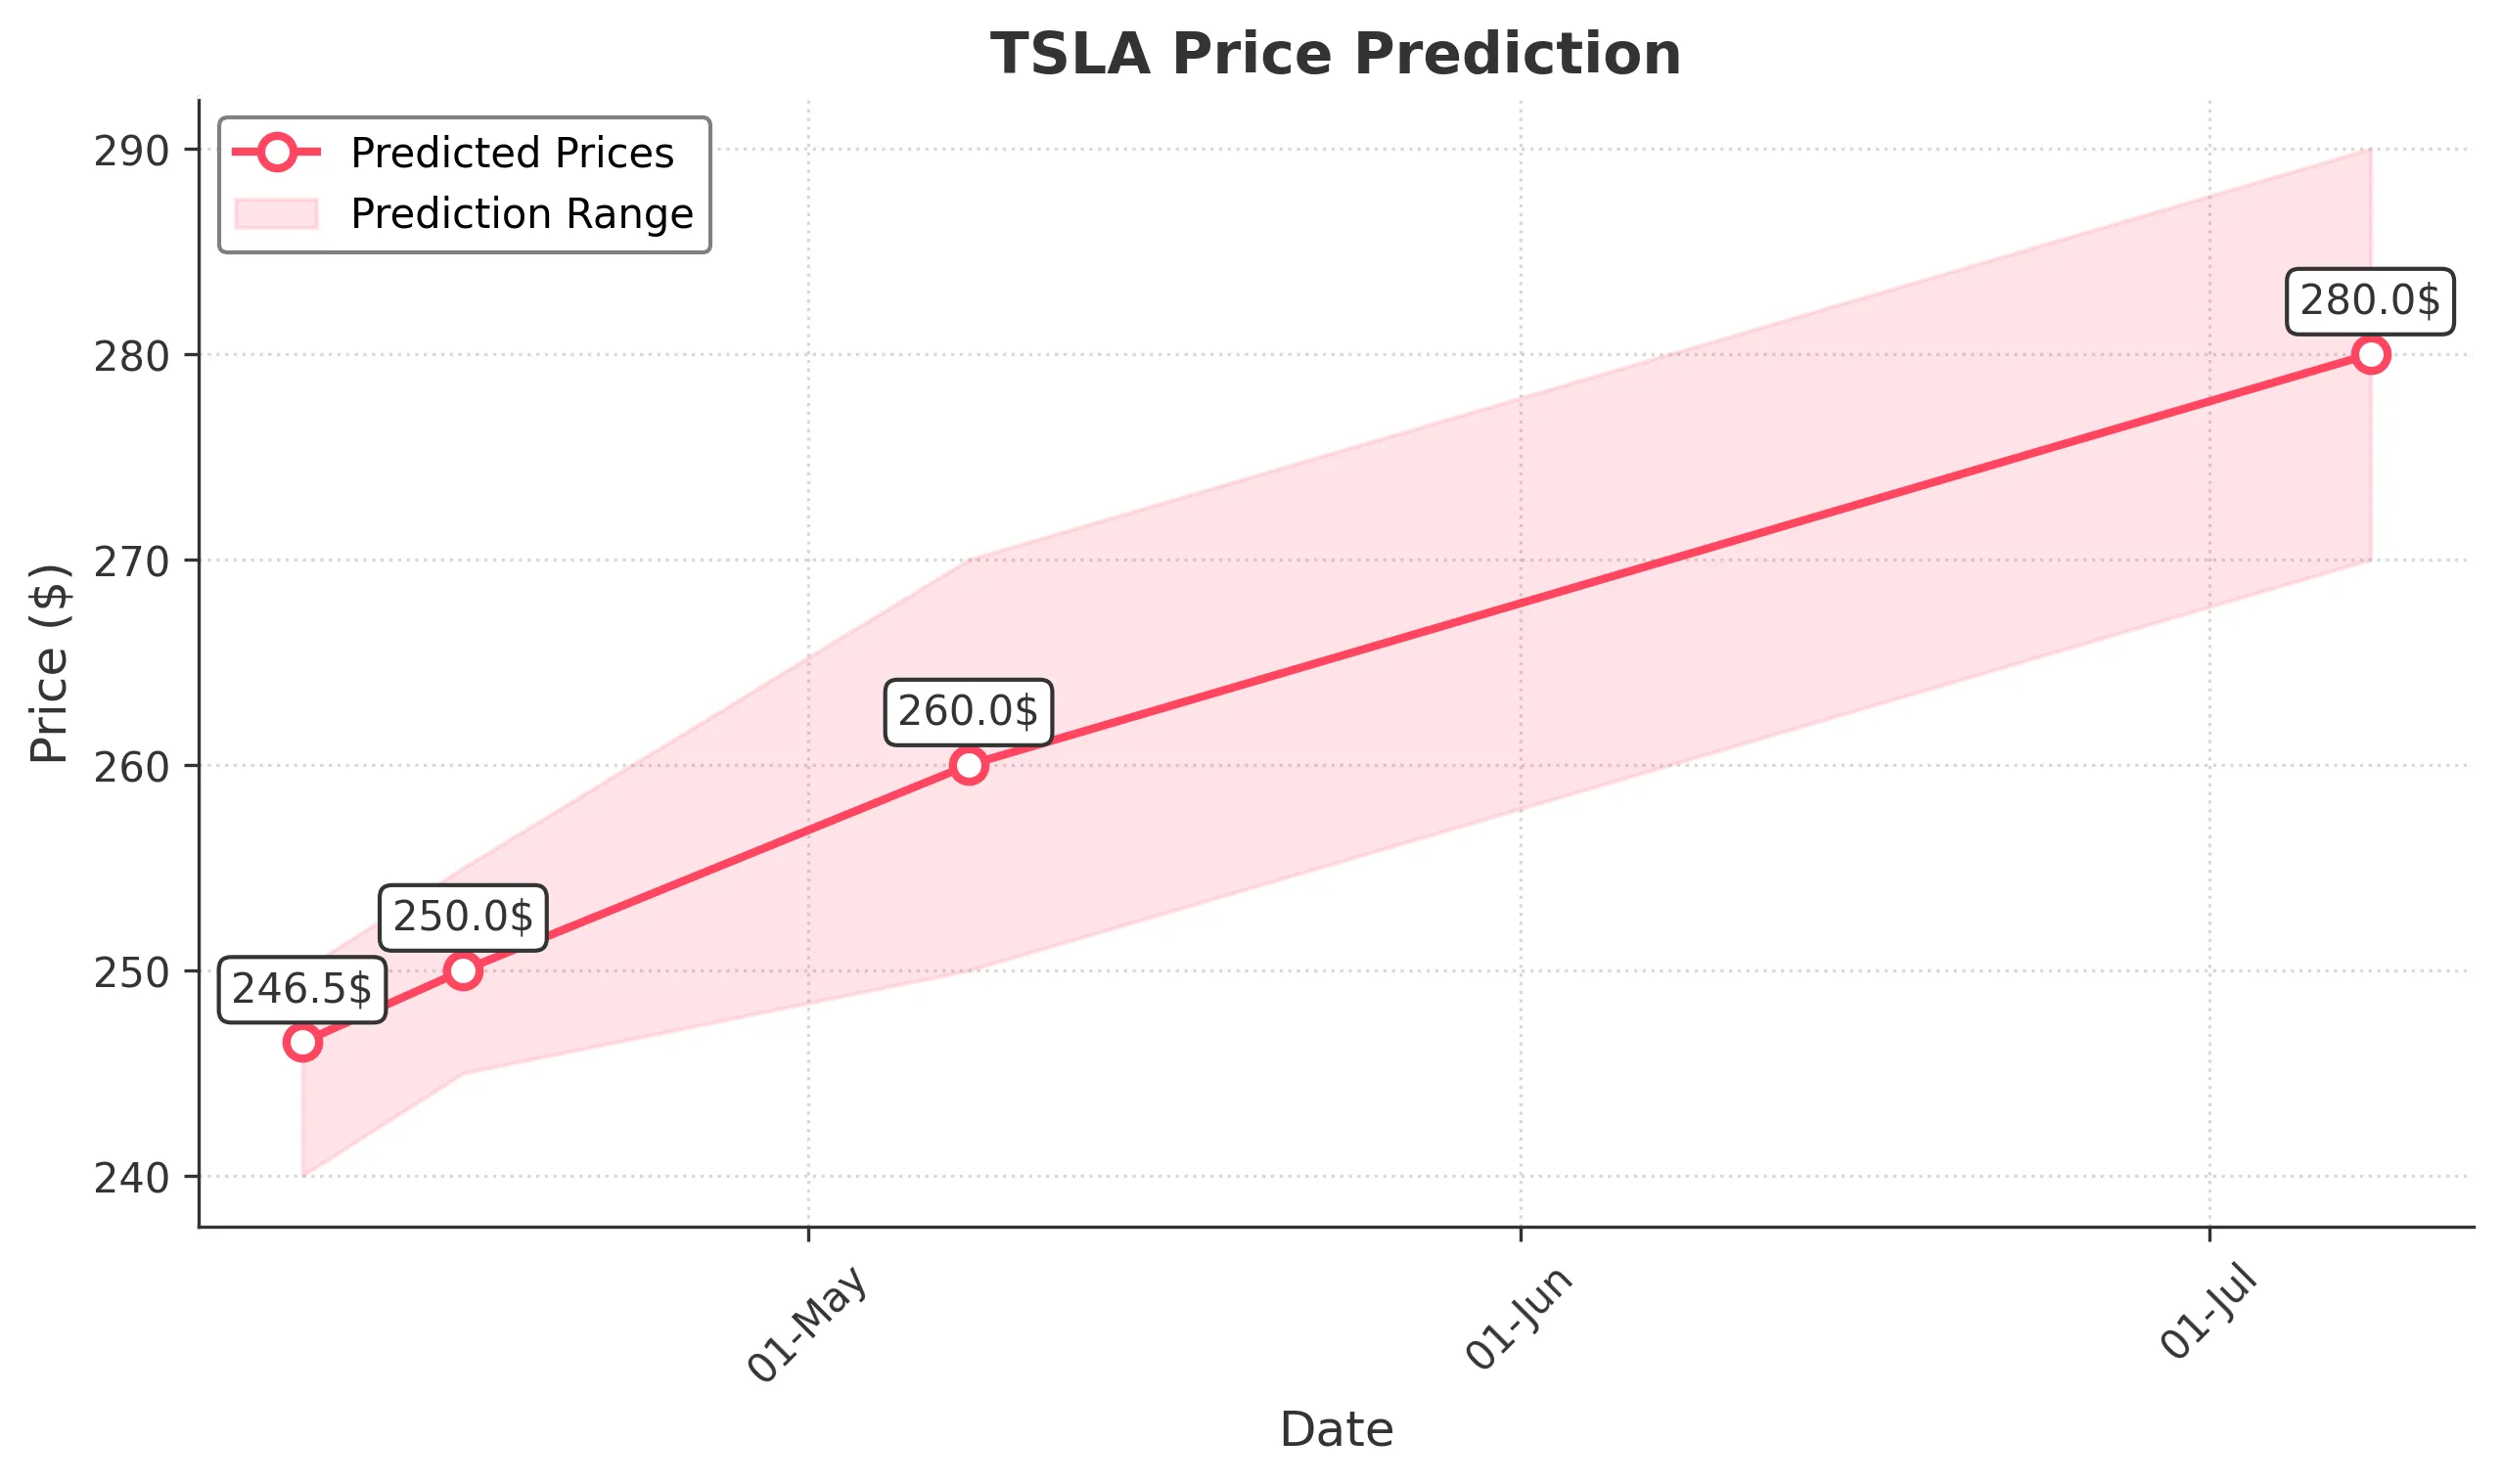
Target: April 9, 2025$246.5
$245
$250
$240
Description
The stock shows a slight bullish trend with a potential bounce from recent lows. RSI indicates oversold conditions, while MACD suggests a possible bullish crossover. However, volatility remains high, and market sentiment is cautious.
Analysis
Over the past 3 months, TSLA has experienced significant volatility, with a bearish trend recently. Key support at $240 and resistance at $280. RSI indicates oversold conditions, while MACD shows potential bullish signals. Volume spikes suggest increased interest, but overall sentiment remains mixed.
Confidence Level
Potential Risks
Market volatility and external news could impact the prediction. A sudden negative sentiment could lead to a drop.
1 Week Prediction
Target: April 16, 2025$250
$248
$255
$245
Description
A potential recovery is indicated as the stock approaches key support levels. The recent candlestick patterns suggest a reversal, but caution is warranted due to overall market conditions and potential resistance at $255.
Analysis
The stock has shown a bearish trend with significant drops. Key support at $240 and resistance at $280. Technical indicators show mixed signals, with RSI indicating oversold conditions. Volume patterns suggest increased trading activity, but market sentiment remains cautious.
Confidence Level
Potential Risks
Unforeseen macroeconomic events or earnings reports could lead to unexpected price movements.
1 Month Prediction
Target: May 8, 2025$260
$255
$270
$250
Description
If the bullish momentum continues, TSLA could see a gradual recovery. The MACD shows signs of a bullish crossover, and RSI may stabilize. However, resistance at $270 could limit upward movement.
Analysis
The stock has been in a bearish phase, with significant price drops. Key support at $240 and resistance at $280. Technical indicators show potential for recovery, but overall market sentiment is mixed. Volume patterns indicate increased trading activity, suggesting investor interest.
Confidence Level
Potential Risks
Market volatility and external factors could hinder recovery. Earnings reports or economic data releases may impact stock performance.
3 Months Prediction
Target: July 8, 2025$280
$275
$290
$270
Description
If the current trend continues, TSLA may recover towards $280. The technical indicators suggest a potential bullish reversal, but resistance levels could pose challenges. Market sentiment will play a crucial role.
Analysis
The stock has faced significant volatility and bearish trends. Key support at $240 and resistance at $280. Technical indicators show mixed signals, with potential for recovery. Volume patterns indicate increased trading activity, but overall market sentiment remains cautious.
Confidence Level
Potential Risks
Long-term predictions are uncertain due to potential market shifts, economic conditions, and company performance.