TSLA Trading Predictions
1 Day Prediction
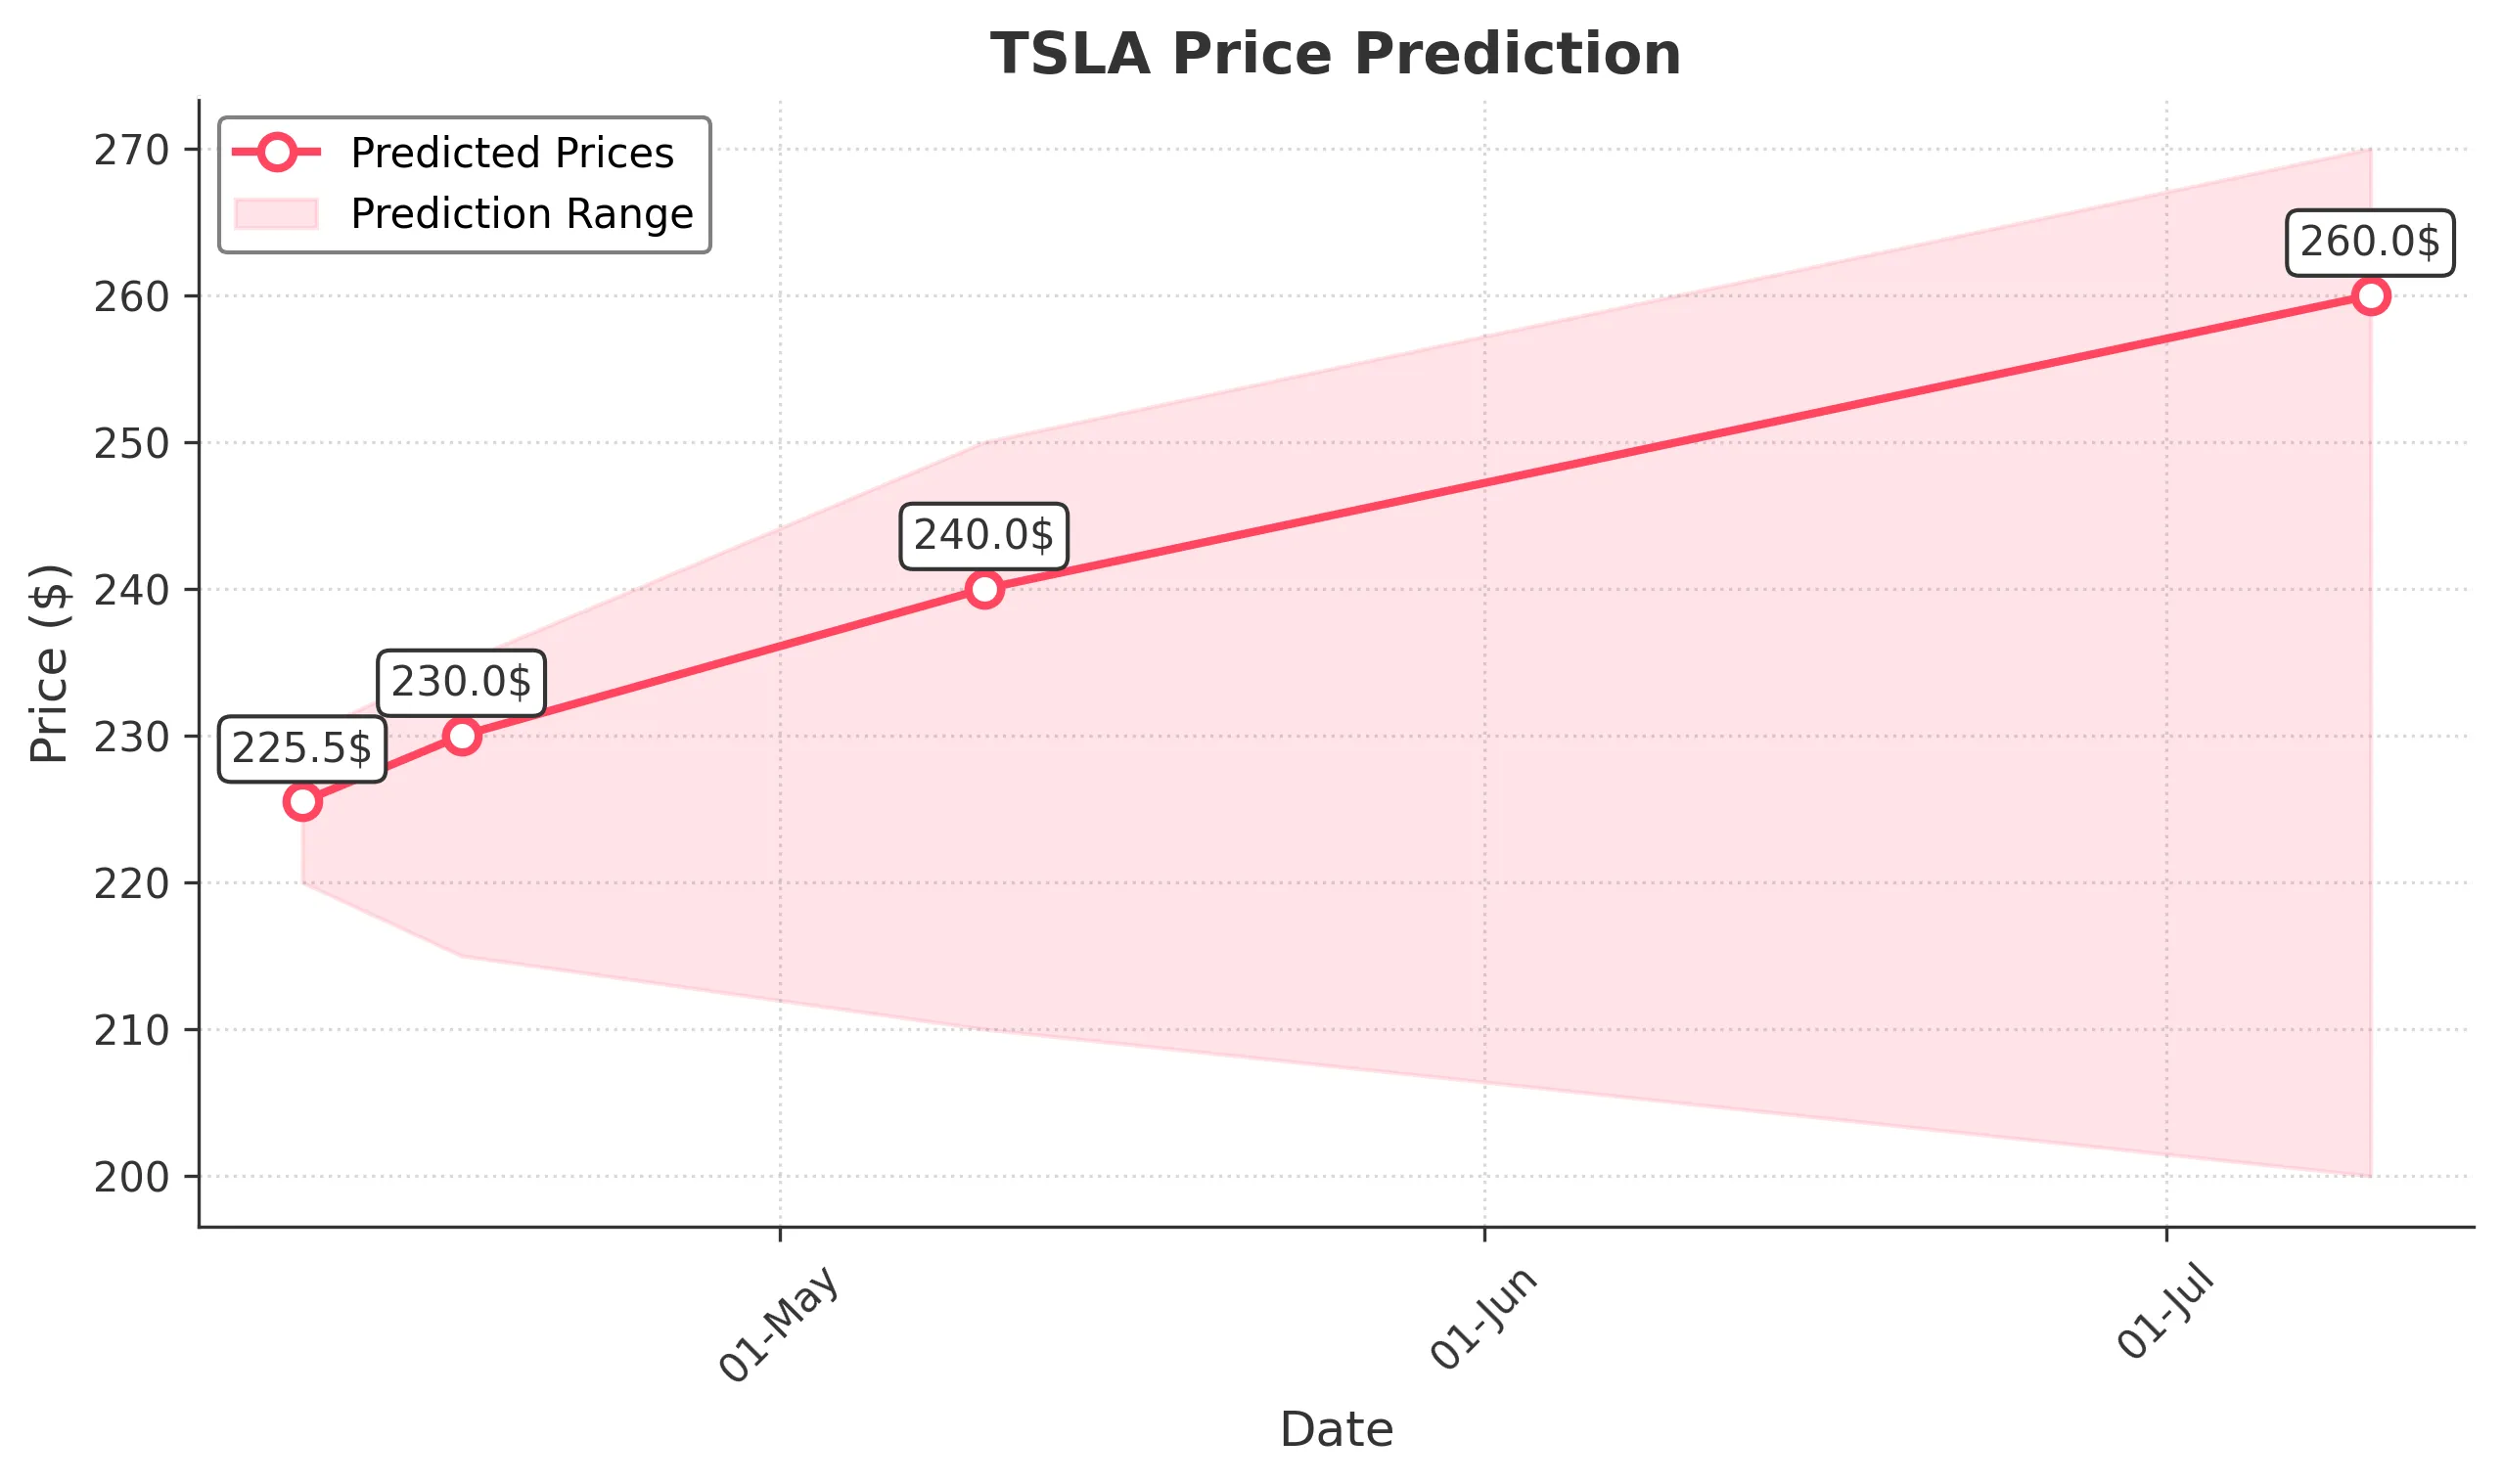
Target: April 10, 2025$225.5
$225
$230
$220
Description
The stock shows a slight bullish trend after recent consolidation. RSI indicates oversold conditions, suggesting a potential bounce. However, resistance at 230 may limit upside. Volume is expected to increase as traders react to recent price movements.
Analysis
TSLA has experienced significant volatility, with a bearish trend over the past month. Key support is around 220, while resistance is at 230. The recent price action shows a potential reversal, but overall sentiment remains cautious due to macroeconomic factors.
Confidence Level
Potential Risks
Market volatility and external news could impact price direction. A failure to break above resistance may lead to further declines.
1 Week Prediction
Target: April 17, 2025$230
$225.5
$235
$215
Description
Expect a gradual recovery as the stock tests resistance levels. The MACD shows a bullish crossover, indicating potential upward momentum. However, the market remains sensitive to broader economic news, which could introduce volatility.
Analysis
The stock has been in a bearish phase, but recent price action suggests a possible bottoming out. Key support at 215 and resistance at 235 are critical levels to monitor. Technical indicators show mixed signals, reflecting market indecision.
Confidence Level
Potential Risks
Uncertainty in market sentiment and potential negative news could reverse the upward trend. Watch for volume spikes that may indicate strong buying or selling pressure.
1 Month Prediction
Target: May 10, 2025$240
$230
$250
$210
Description
A potential recovery is anticipated as the stock approaches key Fibonacci retracement levels. The RSI may stabilize, indicating a shift in momentum. However, macroeconomic factors could still weigh heavily on performance.
Analysis
TSLA's performance has been characterized by high volatility and bearish trends. The stock is currently testing support levels, with resistance at 250. Technical indicators suggest a potential recovery, but external factors remain a significant risk.
Confidence Level
Potential Risks
Economic indicators and earnings reports could lead to unexpected volatility. A failure to maintain upward momentum could result in further declines.
3 Months Prediction
Target: July 10, 2025$260
$250
$270
$200
Description
Longer-term outlook suggests a gradual recovery as market sentiment improves. If the stock can break above 250, it may attract more buyers. However, macroeconomic uncertainties could still pose risks.
Analysis
Over the past three months, TSLA has faced significant downward pressure, with key support at 200. The stock's volatility has been pronounced, and while there are signs of potential recovery, external economic factors could heavily influence future performance.
Confidence Level
Potential Risks
Potential for further declines if economic conditions worsen. Market sentiment remains fragile, and any negative news could lead to significant price drops.