TSLA Trading Predictions
1 Day Prediction
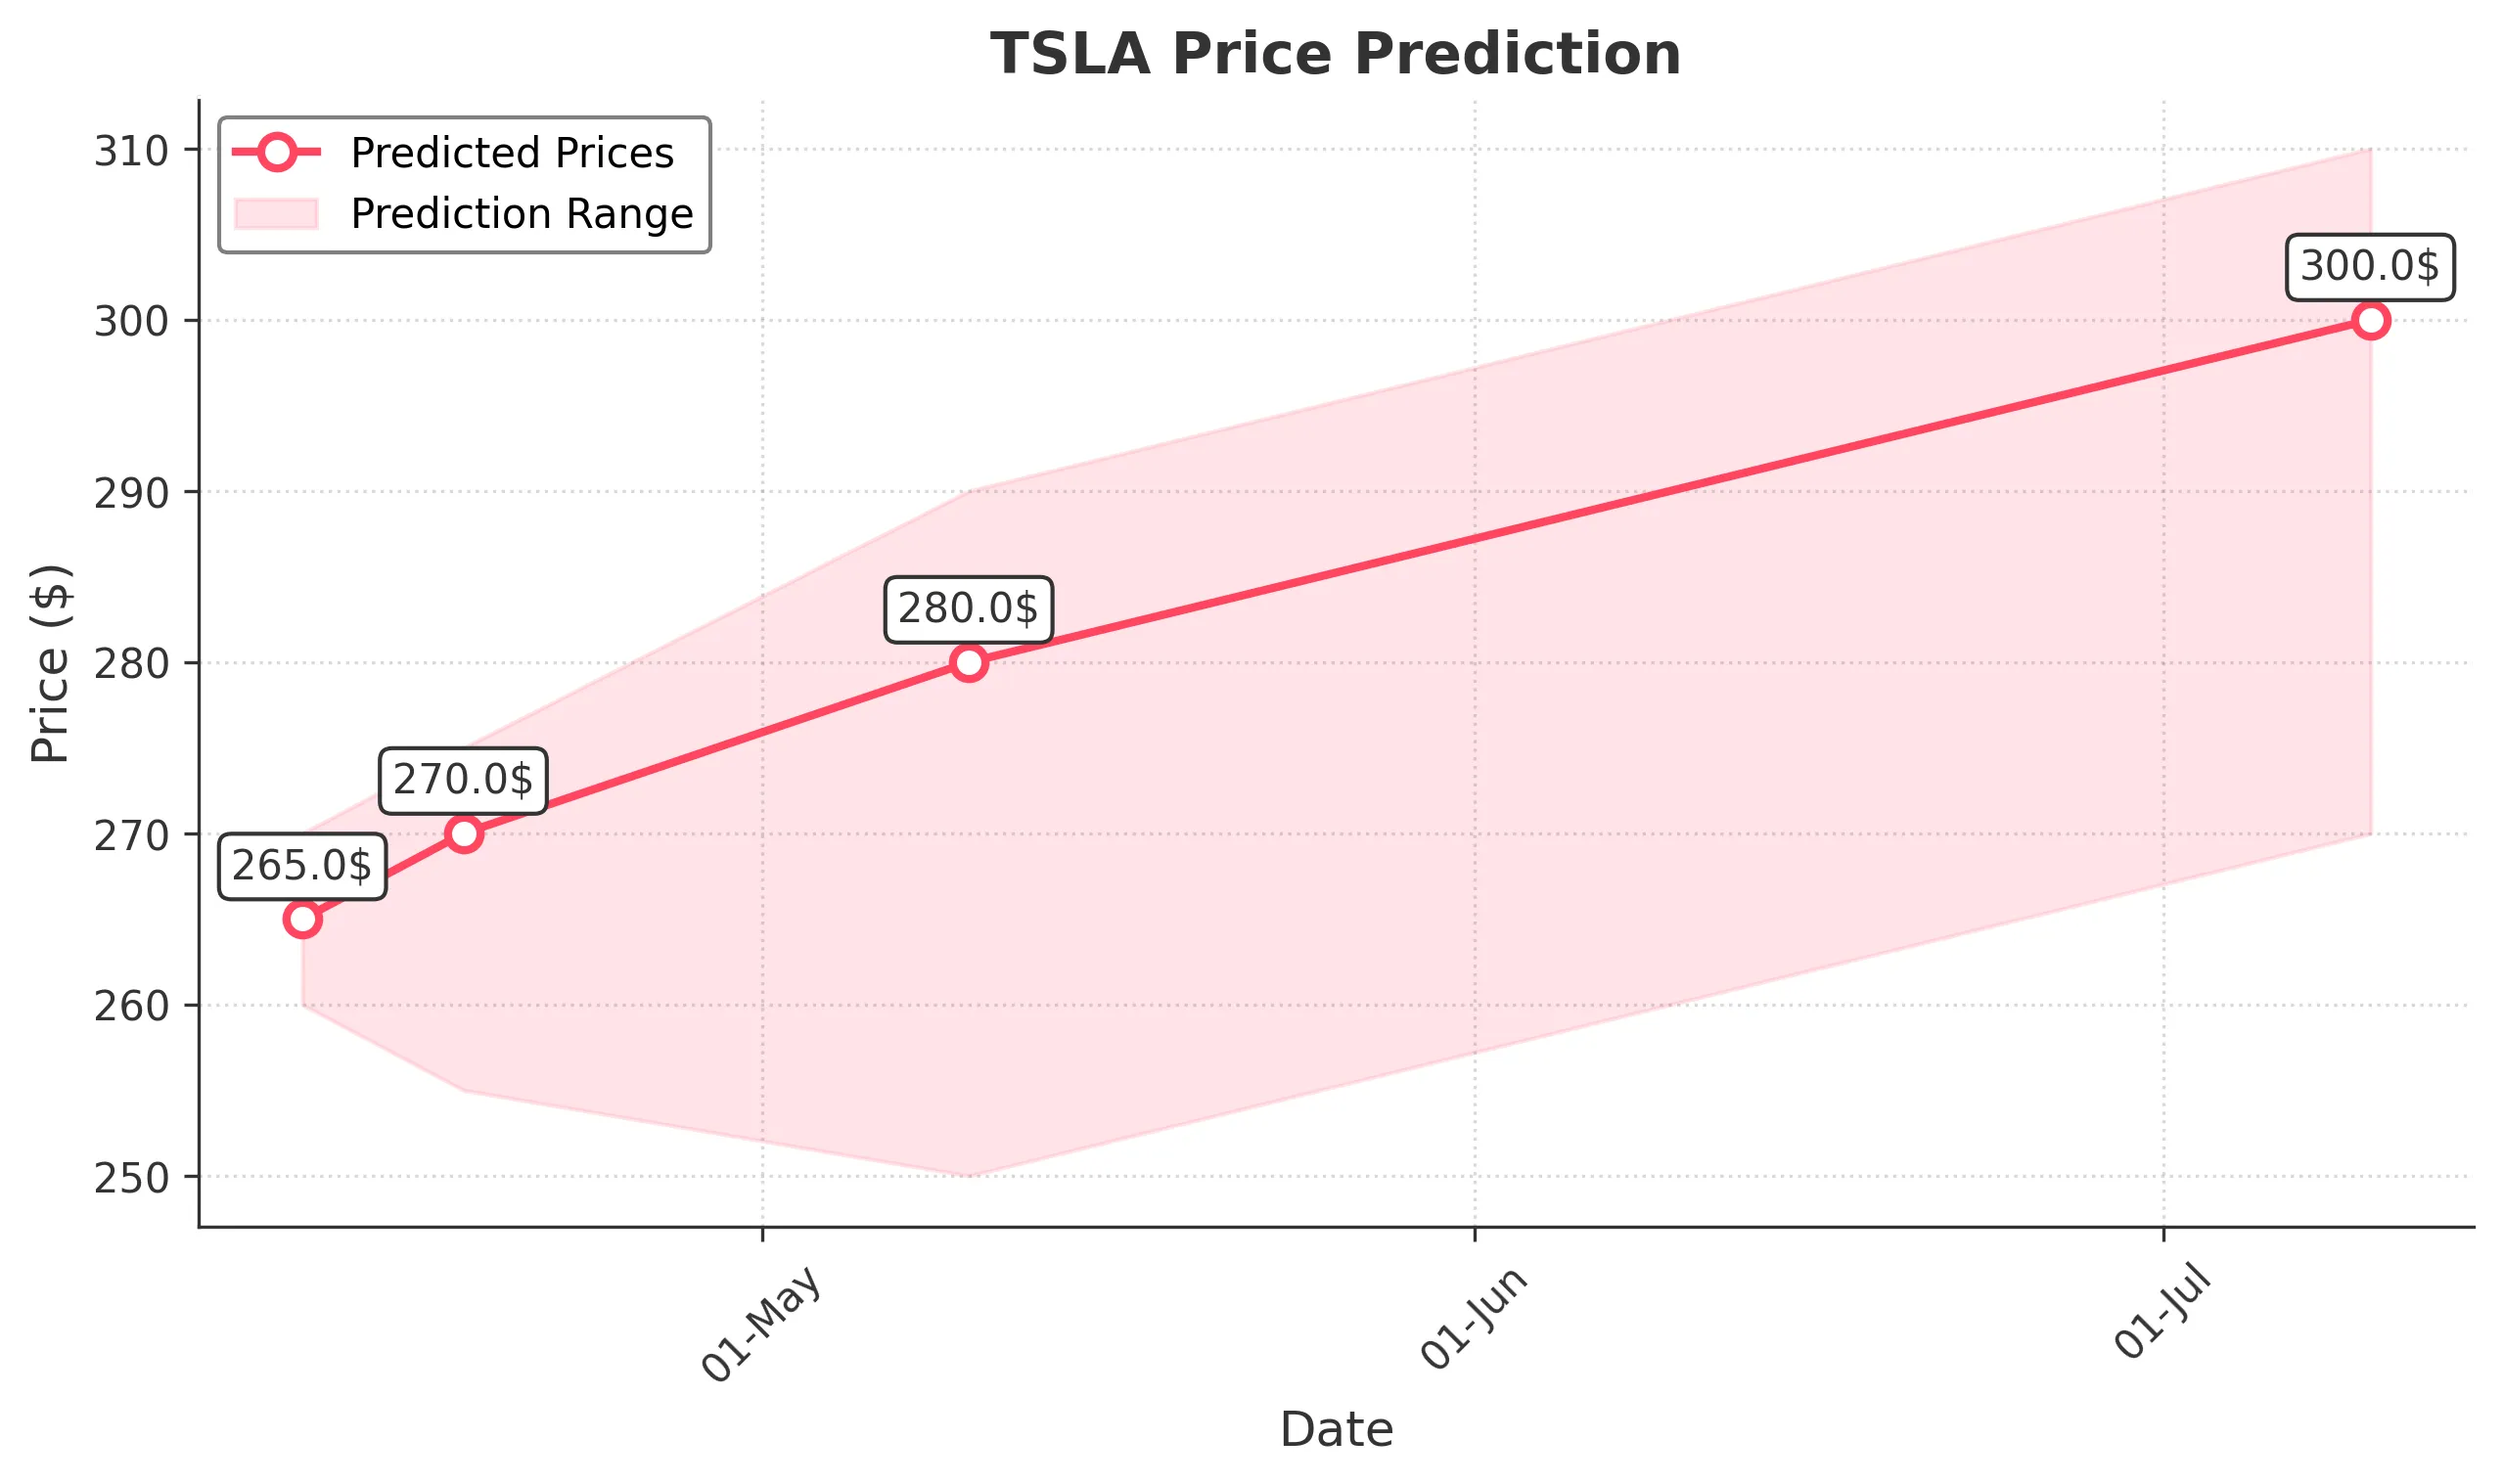
Target: April 11, 2025$265
$263
$270
$260
Description
The stock shows a slight bullish trend with a potential bounce from recent lows. RSI indicates oversold conditions, while MACD is showing a bullish crossover. However, volatility remains high, suggesting caution.
Analysis
TSLA has experienced significant volatility, with a bearish trend recently. Key support at 220 and resistance at 290. Moving averages indicate a potential reversal, but high volume spikes suggest uncertainty. Overall, the market sentiment is mixed.
Confidence Level
Potential Risks
Market sentiment is volatile, and any negative news could reverse the trend quickly.
1 Week Prediction
Target: April 18, 2025$270
$265
$275
$255
Description
Expect a gradual recovery as the stock may find support around 260. The RSI is improving, indicating potential upward momentum. However, resistance at 290 could limit gains.
Analysis
The stock has shown signs of recovery but remains in a bearish trend overall. Key support at 220 and resistance at 290. Volume analysis indicates potential accumulation, but macroeconomic factors could weigh heavily on performance.
Confidence Level
Potential Risks
Continued market volatility and external economic factors could impact the stock's performance.
1 Month Prediction
Target: May 10, 2025$280
$270
$290
$250
Description
A potential bullish reversal is anticipated as the stock approaches key support levels. The MACD shows signs of bullish divergence, but caution is advised due to overall market conditions.
Analysis
TSLA's performance has been bearish, with significant price drops. Key support at 220 and resistance at 290. Technical indicators suggest a possible reversal, but external factors and market sentiment remain uncertain.
Confidence Level
Potential Risks
Unforeseen macroeconomic events could lead to further declines, impacting the prediction.
3 Months Prediction
Target: July 10, 2025$300
$290
$310
$270
Description
If the stock can maintain upward momentum, a recovery towards 300 is possible. However, macroeconomic conditions and competition in the EV market could pose risks.
Analysis
The stock has been in a bearish trend, with significant fluctuations. Key support at 220 and resistance at 290. Technical indicators show potential for recovery, but external factors could hinder progress.
Confidence Level
Potential Risks
Market volatility and potential negative news could significantly impact the stock's trajectory.