TSLA Trading Predictions
1 Day Prediction
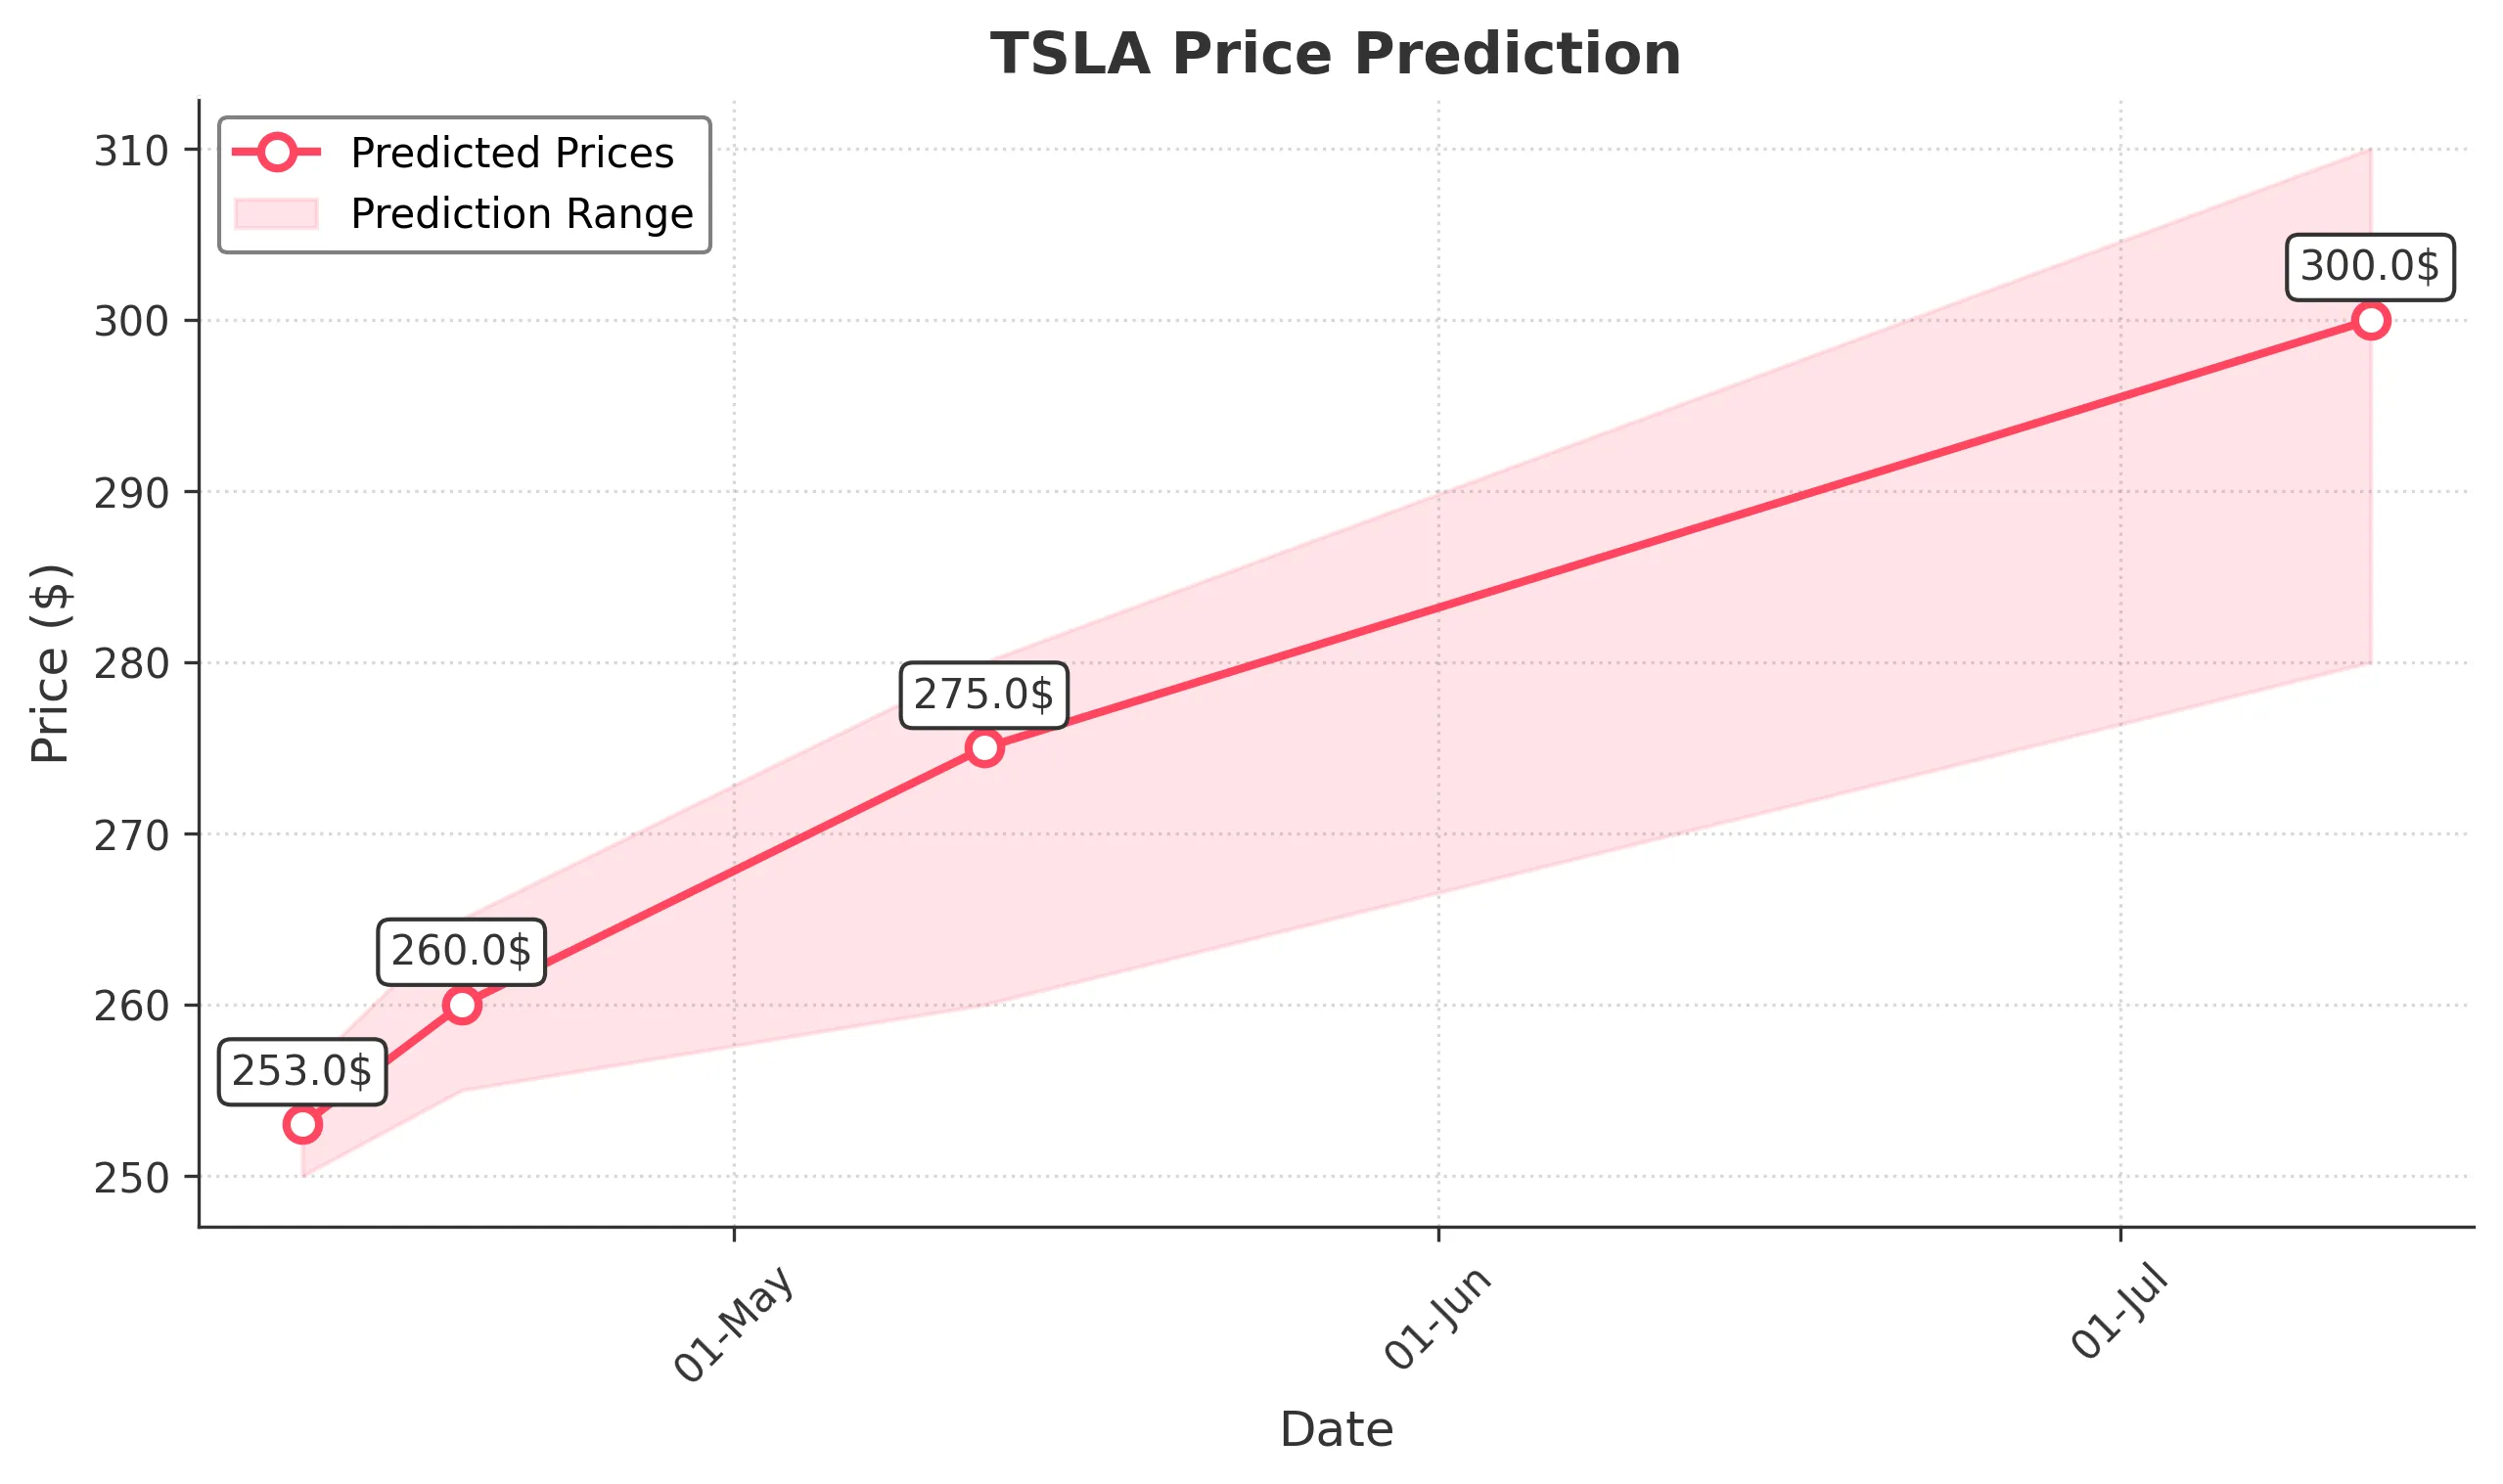
Target: April 12, 2025$253
$252
$256
$250
Description
The stock shows a slight bullish trend with a potential bounce from recent lows. RSI indicates oversold conditions, while MACD is showing a bullish crossover. However, volatility remains high, suggesting caution.
Analysis
Over the past 3 months, TSLA has experienced significant volatility, with a bearish trend recently. Key support is around 220, while resistance is near 290. Volume spikes indicate strong selling pressure, but recent candlestick patterns suggest potential for a short-term rebound.
Confidence Level
Potential Risks
Market sentiment could shift due to macroeconomic news or earnings reports, which may impact the prediction.
1 Week Prediction
Target: April 19, 2025$260
$258
$265
$255
Description
A potential recovery is indicated as the stock may find support at recent lows. The Bollinger Bands suggest a squeeze, indicating a possible breakout. However, bearish sentiment persists, which could limit upside.
Analysis
The stock has been in a bearish phase, with significant selling pressure. Key resistance levels are around 270, while support is at 250. Technical indicators show mixed signals, with RSI indicating potential for a bounce, but MACD remains bearish.
Confidence Level
Potential Risks
Uncertainty in market conditions and external factors could lead to unexpected price movements.
1 Month Prediction
Target: May 12, 2025$275
$270
$280
$260
Description
If the stock can maintain momentum, a gradual recovery is expected. The Fibonacci retracement levels suggest potential resistance at 280. However, macroeconomic factors could influence market sentiment negatively.
Analysis
The past three months have shown a bearish trend with significant price fluctuations. Support is at 250, while resistance is at 290. Volume analysis indicates strong selling pressure, but recent patterns suggest a possible stabilization.
Confidence Level
Potential Risks
Market volatility and external economic conditions may hinder recovery efforts.
3 Months Prediction
Target: July 12, 2025$300
$295
$310
$280
Description
A longer-term recovery may be underway if the stock can break above key resistance levels. Positive market sentiment and potential product announcements could drive prices higher, but caution is warranted.
Analysis
The stock has faced significant challenges, with a bearish trend dominating. Key resistance is at 290, while support is at 250. Technical indicators show mixed signals, and external factors could heavily influence future performance.
Confidence Level
Potential Risks
Long-term predictions are uncertain due to potential market shifts and economic conditions.