TSLA Trading Predictions
1 Day Prediction
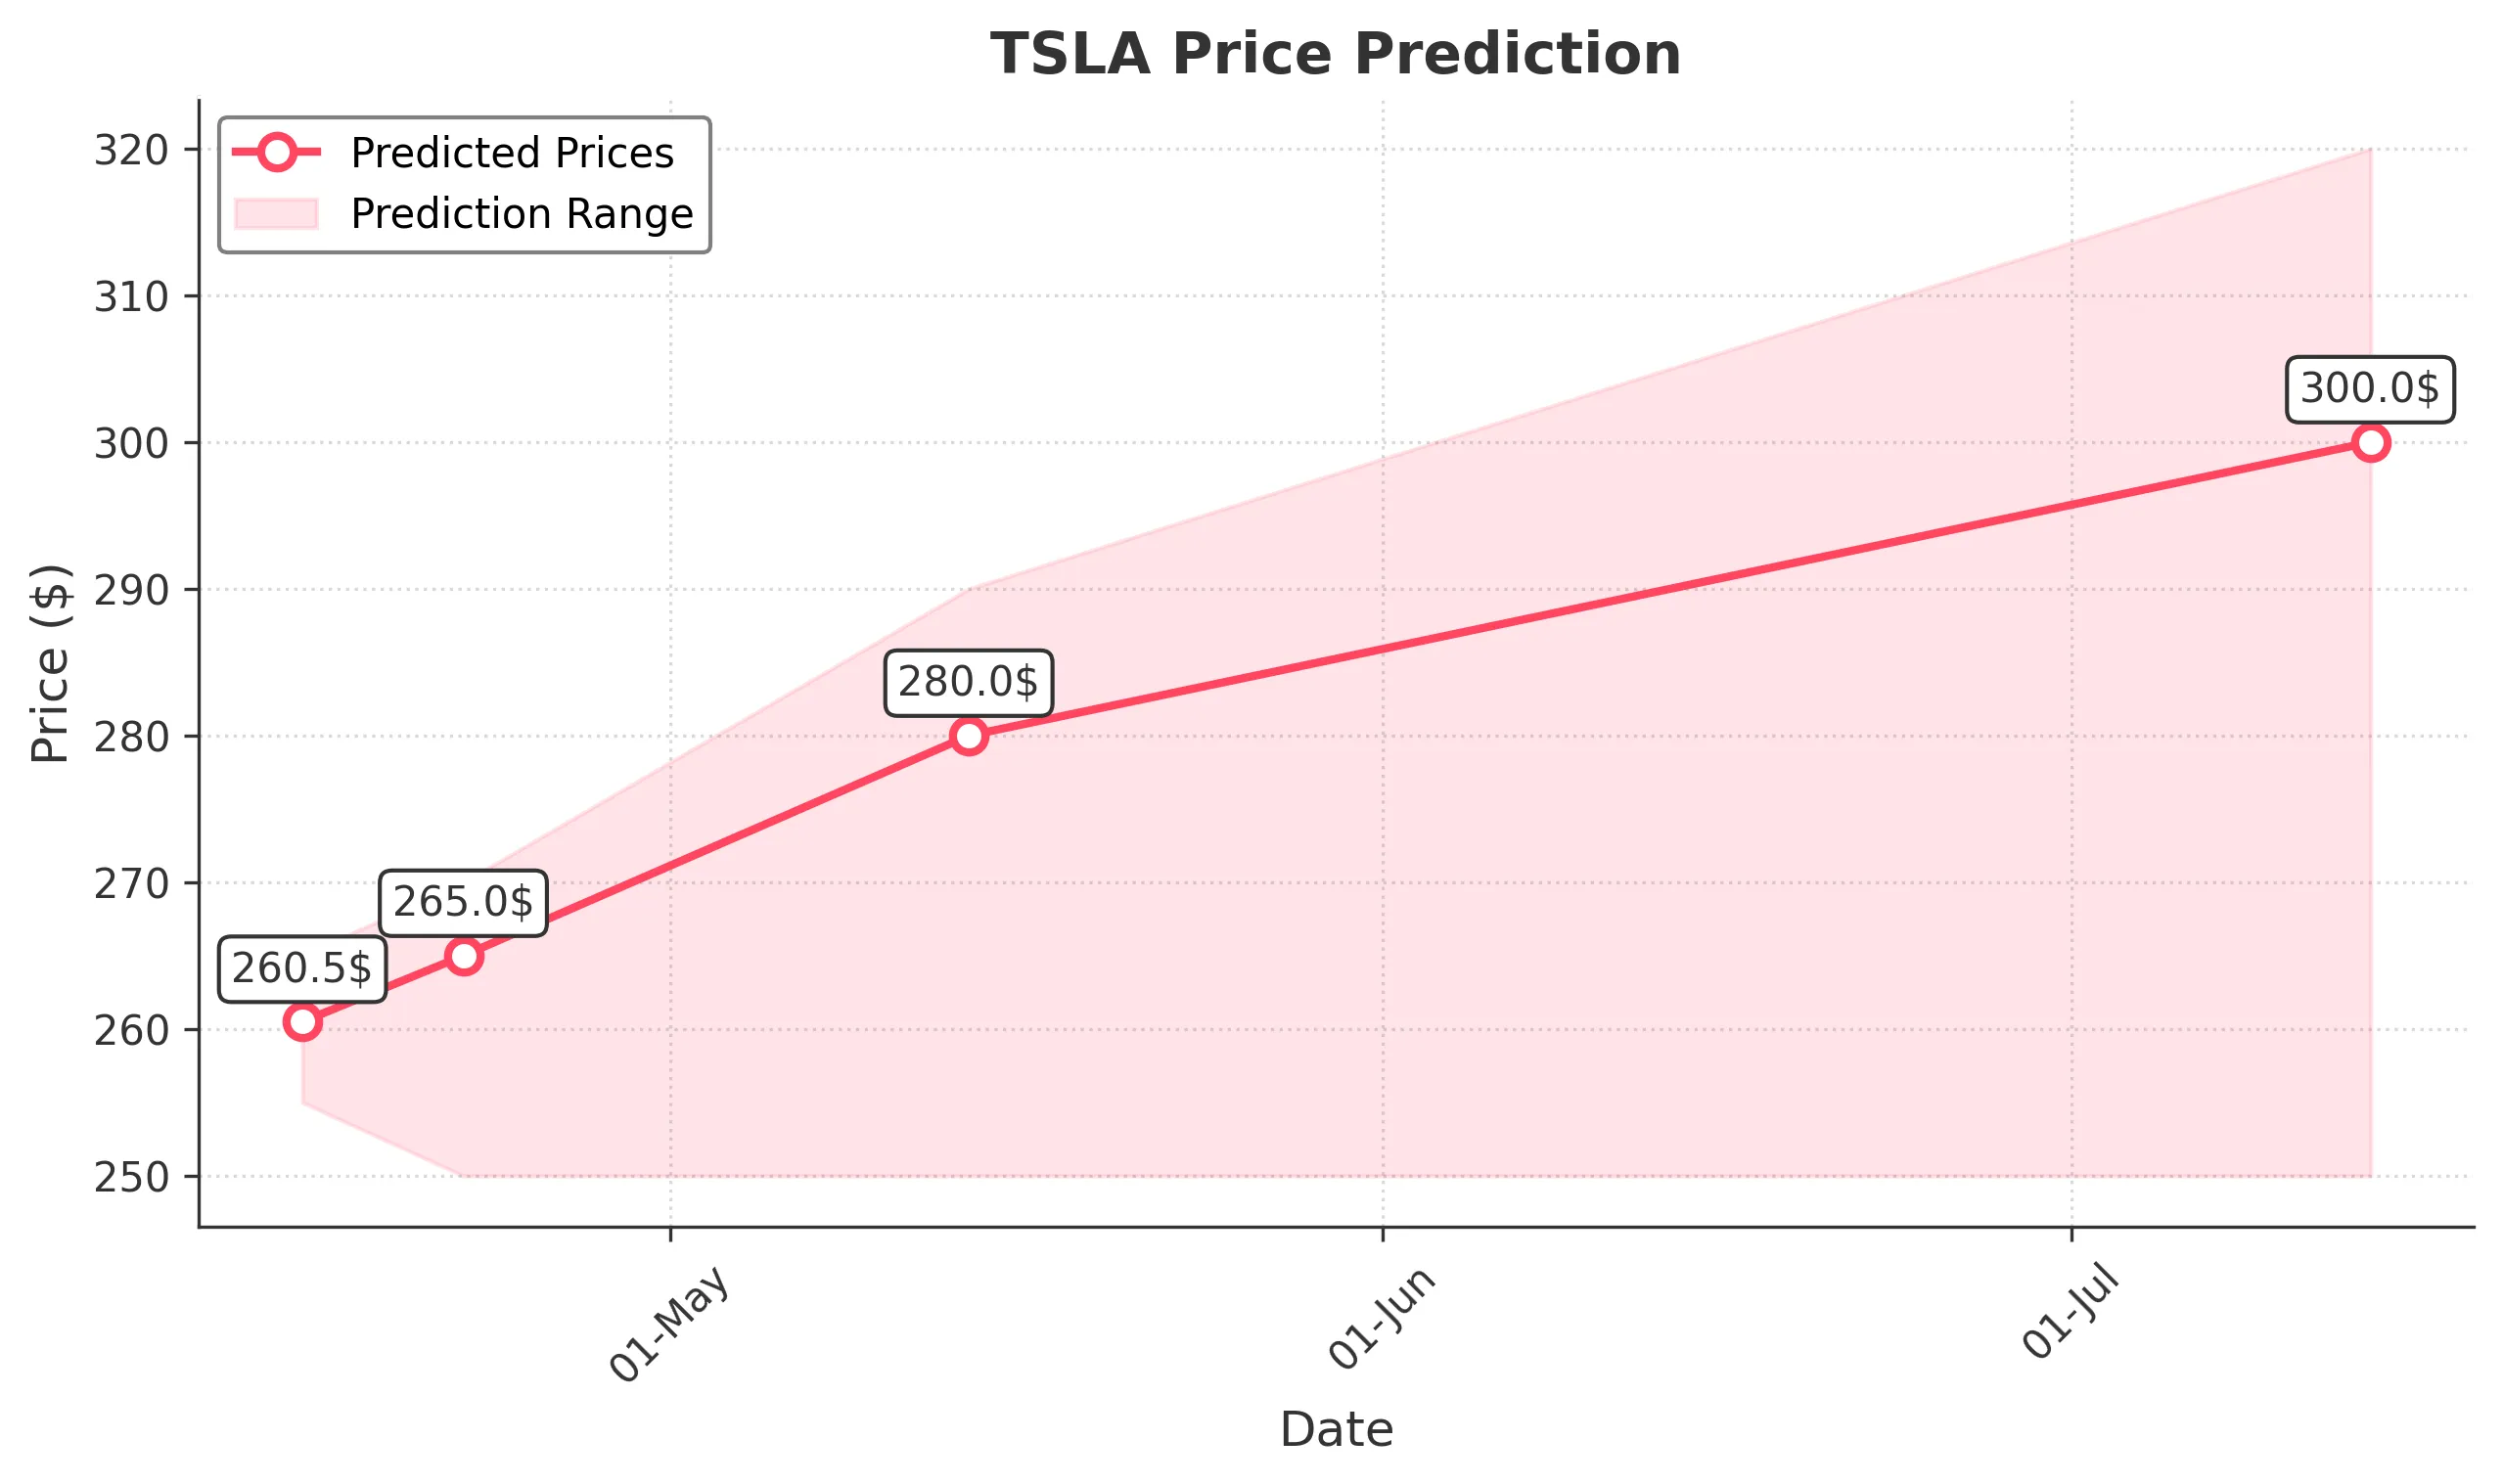
Target: April 15, 2025$260.5
$258.5
$265
$255
Description
The stock shows a slight bullish trend with a potential bounce from recent support around 255. The RSI is near 40, indicating potential for upward movement. However, recent volatility suggests caution.
Analysis
Over the past 3 months, TSLA has shown significant volatility, with a bearish trend recently. Key support is around 255, while resistance is at 270. The MACD is bearish, and volume spikes indicate uncertainty. Overall, the outlook is cautious.
Confidence Level
Potential Risks
Market sentiment is mixed, and any negative news could reverse the trend quickly.
1 Week Prediction
Target: April 22, 2025$265
$260
$270
$250
Description
Expect a slight recovery as the stock tests resistance at 270. The MACD shows signs of convergence, indicating potential bullish momentum. However, the overall market remains volatile.
Analysis
The stock has been in a bearish phase, with significant drops in price. Support at 250 is critical, while resistance at 270 may limit upward movement. The RSI indicates oversold conditions, suggesting a possible rebound.
Confidence Level
Potential Risks
External factors such as macroeconomic data releases could impact the stock's performance.
1 Month Prediction
Target: May 14, 2025$280
$265
$290
$250
Description
A gradual recovery is anticipated as the stock approaches the 290 resistance level. The Bollinger Bands indicate potential for upward movement, but caution is advised due to recent volatility.
Analysis
TSLA has experienced significant fluctuations, with a bearish trend recently. Key support at 250 and resistance at 290 are critical. The MACD is showing signs of potential bullish divergence, but overall market conditions are uncertain.
Confidence Level
Potential Risks
Market sentiment remains fragile, and any negative news could derail the recovery.
3 Months Prediction
Target: July 14, 2025$300
$290
$320
$250
Description
Longer-term outlook suggests a recovery towards 300, driven by potential positive earnings reports. However, the market remains sensitive to macroeconomic factors.
Analysis
The stock has been in a bearish trend, with significant price drops. Key support at 250 and resistance at 320 are crucial. The overall market sentiment is cautious, and while there are signs of recovery, risks remain high.
Confidence Level
Potential Risks
Unforeseen market events or economic downturns could significantly impact the stock's trajectory.