TSLA Trading Predictions
1 Day Prediction
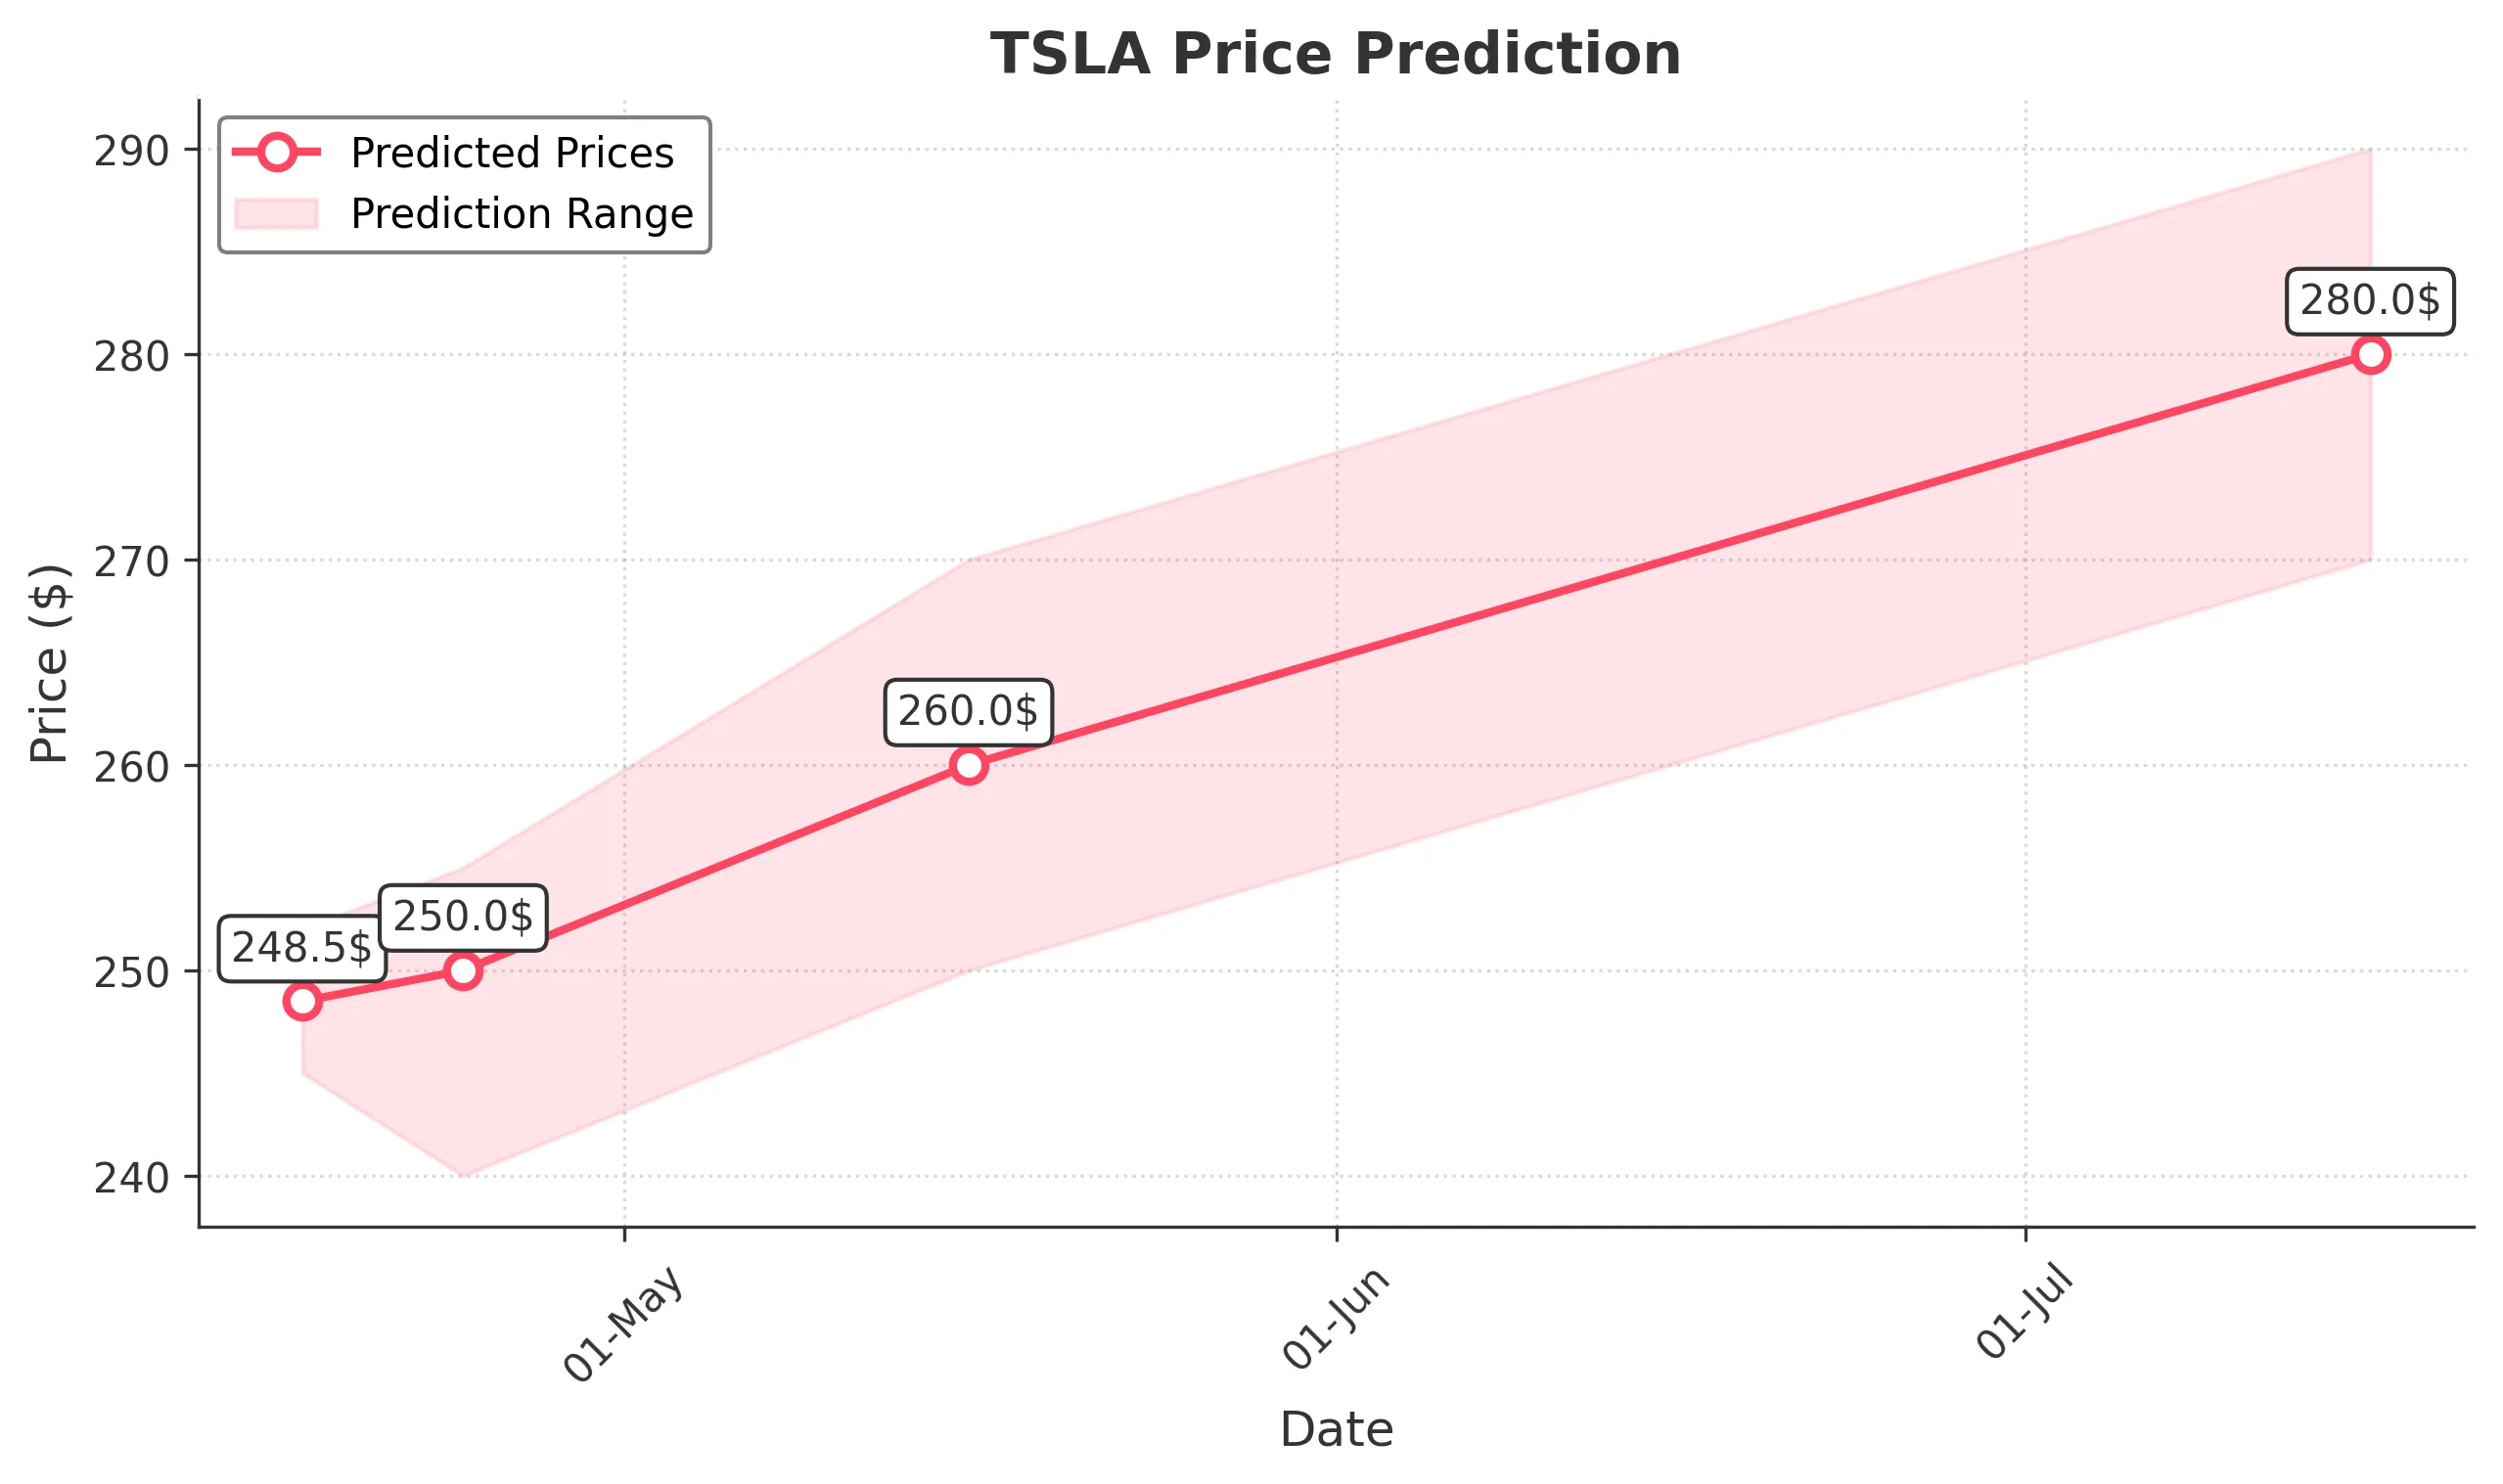
Target: April 17, 2025$248.5
$247.5
$252
$245
Description
The stock shows a slight bearish trend with recent lower highs and lower lows. RSI indicates oversold conditions, suggesting a potential bounce. However, MACD is bearish, and volume has been declining, indicating caution.
Analysis
Over the past 3 months, TSLA has experienced significant volatility, with a bearish trend evident since mid-February. Key support is around $240, while resistance is near $260. Volume spikes on down days suggest selling pressure. Technical indicators show mixed signals, with RSI indicating oversold conditions but MACD remaining bearish.
Confidence Level
Potential Risks
Market volatility and external news could impact the prediction. A reversal pattern could emerge if bullish sentiment returns.
1 Week Prediction
Target: April 24, 2025$250
$248
$255
$240
Description
A potential short-term recovery is expected as the stock approaches key support levels. The RSI may recover from oversold territory, but MACD remains bearish. Watch for volume increases to confirm any upward movement.
Analysis
The stock has been in a bearish phase, with significant declines since February. Support at $240 is critical, while resistance is at $260. The recent volume patterns indicate selling pressure, but a potential reversal could occur if bullish sentiment returns.
Confidence Level
Potential Risks
Uncertainty remains due to macroeconomic factors and potential earnings reports that could sway market sentiment.
1 Month Prediction
Target: May 16, 2025$260
$255
$270
$250
Description
Expect a gradual recovery as the stock may find support at $240. If bullish momentum builds, the price could test resistance at $270. Watch for volume spikes to confirm upward trends.
Analysis
TSLA has shown a bearish trend with significant volatility. Key support at $240 and resistance at $270 are critical levels. The stock's performance is influenced by broader market trends and macroeconomic factors, with mixed signals from technical indicators.
Confidence Level
Potential Risks
Market sentiment is fragile, and any negative news could derail recovery efforts. Earnings reports may also impact stock performance.
3 Months Prediction
Target: July 16, 2025$280
$275
$290
$270
Description
If the stock can maintain above $240, a recovery towards $280 is plausible. However, macroeconomic conditions and market sentiment will play a significant role in this trajectory.
Analysis
The stock has been in a bearish trend, with significant volatility. Key support at $240 and resistance at $270 are critical. The overall market sentiment and macroeconomic conditions will heavily influence TSLA's performance in the coming months.
Confidence Level
Potential Risks
Long-term predictions are uncertain due to potential market shifts and economic factors that could impact TSLA's performance.