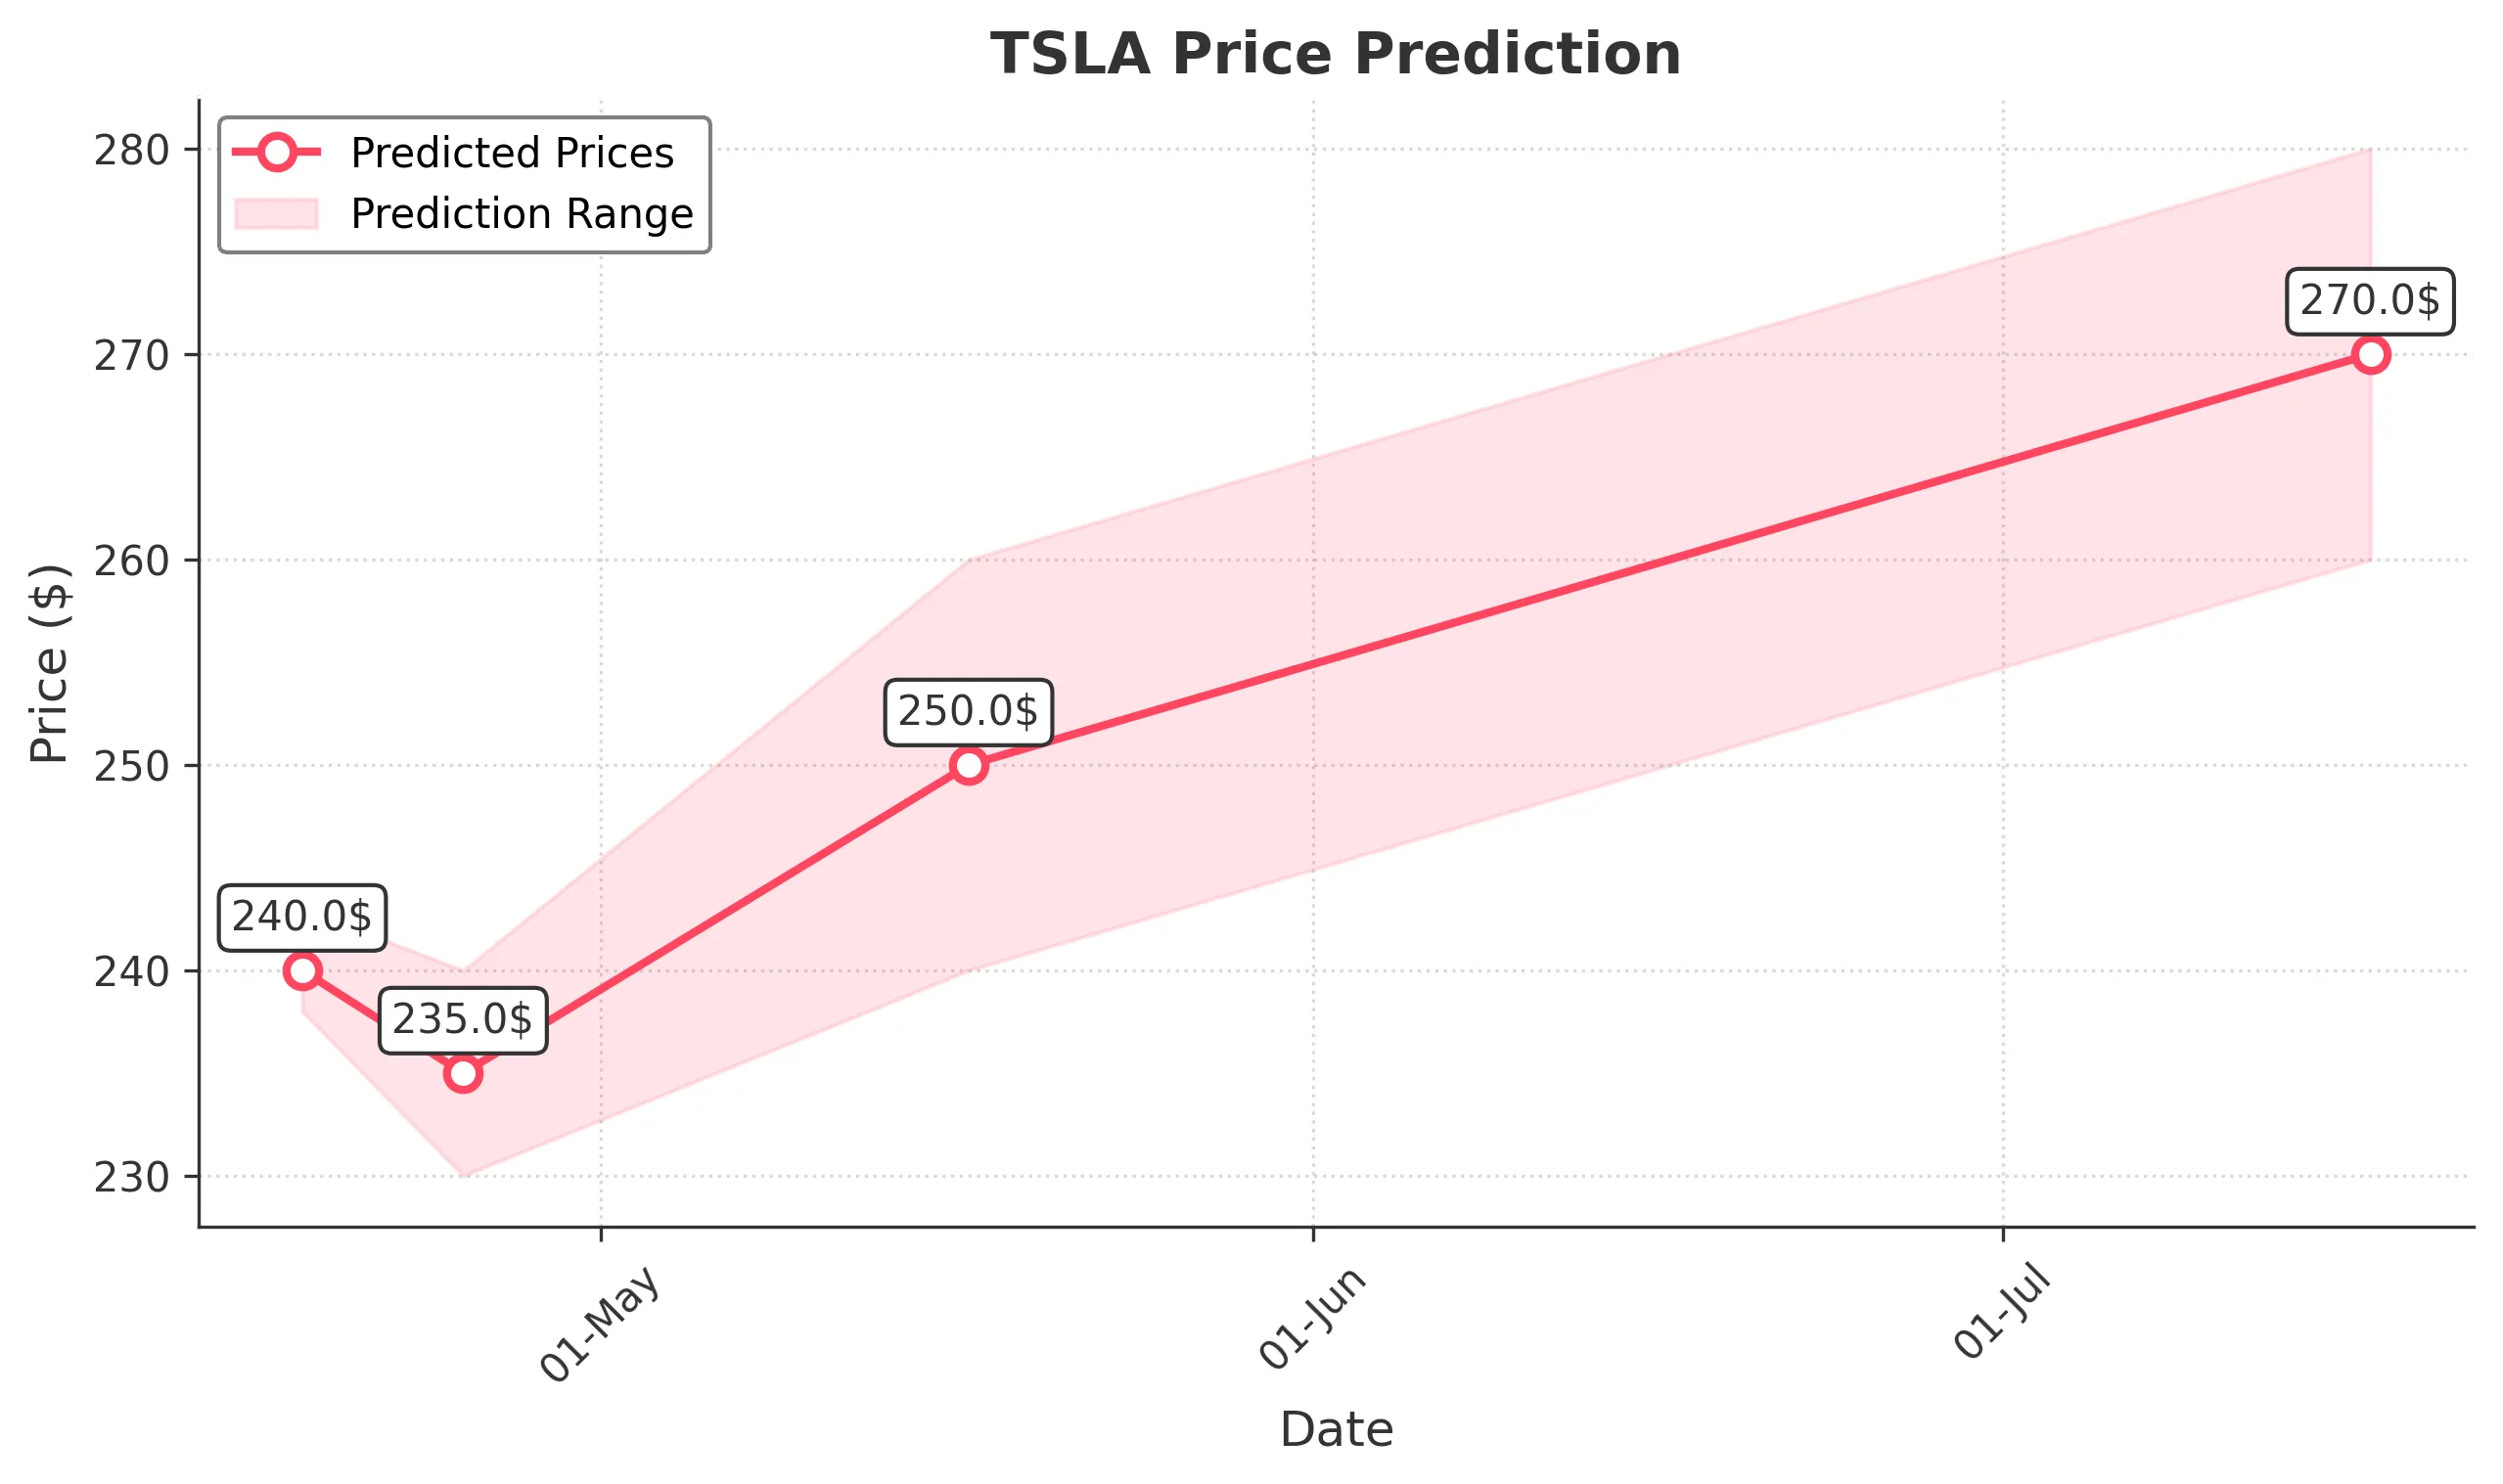
TSLA Trading Predictions

1 Day Prediction
Target: April 18, 2025$240
$241
$243
$238
Description
The stock shows bearish momentum with a recent downtrend. The RSI indicates oversold conditions, but a potential bounce could occur. MACD is negative, suggesting continued weakness. Volume remains high, indicating strong selling pressure.
Analysis
Over the past 3 months, TSLA has experienced significant volatility, with a bearish trend evident since late January. Key support is around 240, while resistance is near 260. The MACD and RSI suggest bearish momentum, but recent volume spikes indicate potential for short-term rebounds.
Confidence Level
Potential Risks
Market sentiment is volatile, and any unexpected news could lead to further declines or a reversal.
1 Week Prediction
Target: April 25, 2025$235
$238
$240
$230
Description
The bearish trend is expected to continue, with potential for a slight recovery. The Bollinger Bands indicate a squeeze, suggesting volatility ahead. However, the overall sentiment remains negative, and selling pressure could persist.
Analysis
TSLA's performance has been characterized by a downward trend, with significant resistance at 260. The recent price action shows a lack of buying interest, and the ATR indicates high volatility. The market sentiment is cautious, reflecting broader economic concerns.
Confidence Level
Potential Risks
Unforeseen macroeconomic events or earnings reports could impact the stock's performance significantly.
1 Month Prediction
Target: May 17, 2025$250
$245
$260
$240
Description
A potential recovery could occur as the stock approaches key support levels. The RSI may begin to show bullish divergence, indicating a possible reversal. However, the overall trend remains bearish, and caution is advised.
Analysis
The stock has been in a bearish phase, with significant support at 240. The MACD is showing signs of potential reversal, but the overall sentiment remains weak. Volume patterns suggest that selling pressure is still dominant, but a recovery could be on the horizon if support holds.
Confidence Level
Potential Risks
The market remains unpredictable, and any negative news could derail recovery efforts.
3 Months Prediction
Target: July 17, 2025$270
$265
$280
$260
Description
If the stock can stabilize above key support levels, a gradual recovery may occur. The potential for bullish patterns to emerge exists, but macroeconomic factors will play a crucial role in determining the trajectory.
Analysis
The stock has faced significant challenges over the past three months, with a clear bearish trend. Key resistance is at 280, while support is at 240. The market sentiment is cautious, and any recovery will depend on broader economic conditions and company performance.
Confidence Level
Potential Risks
Long-term predictions are highly uncertain due to market volatility and external economic factors.
