TSLA Trading Predictions
1 Day Prediction
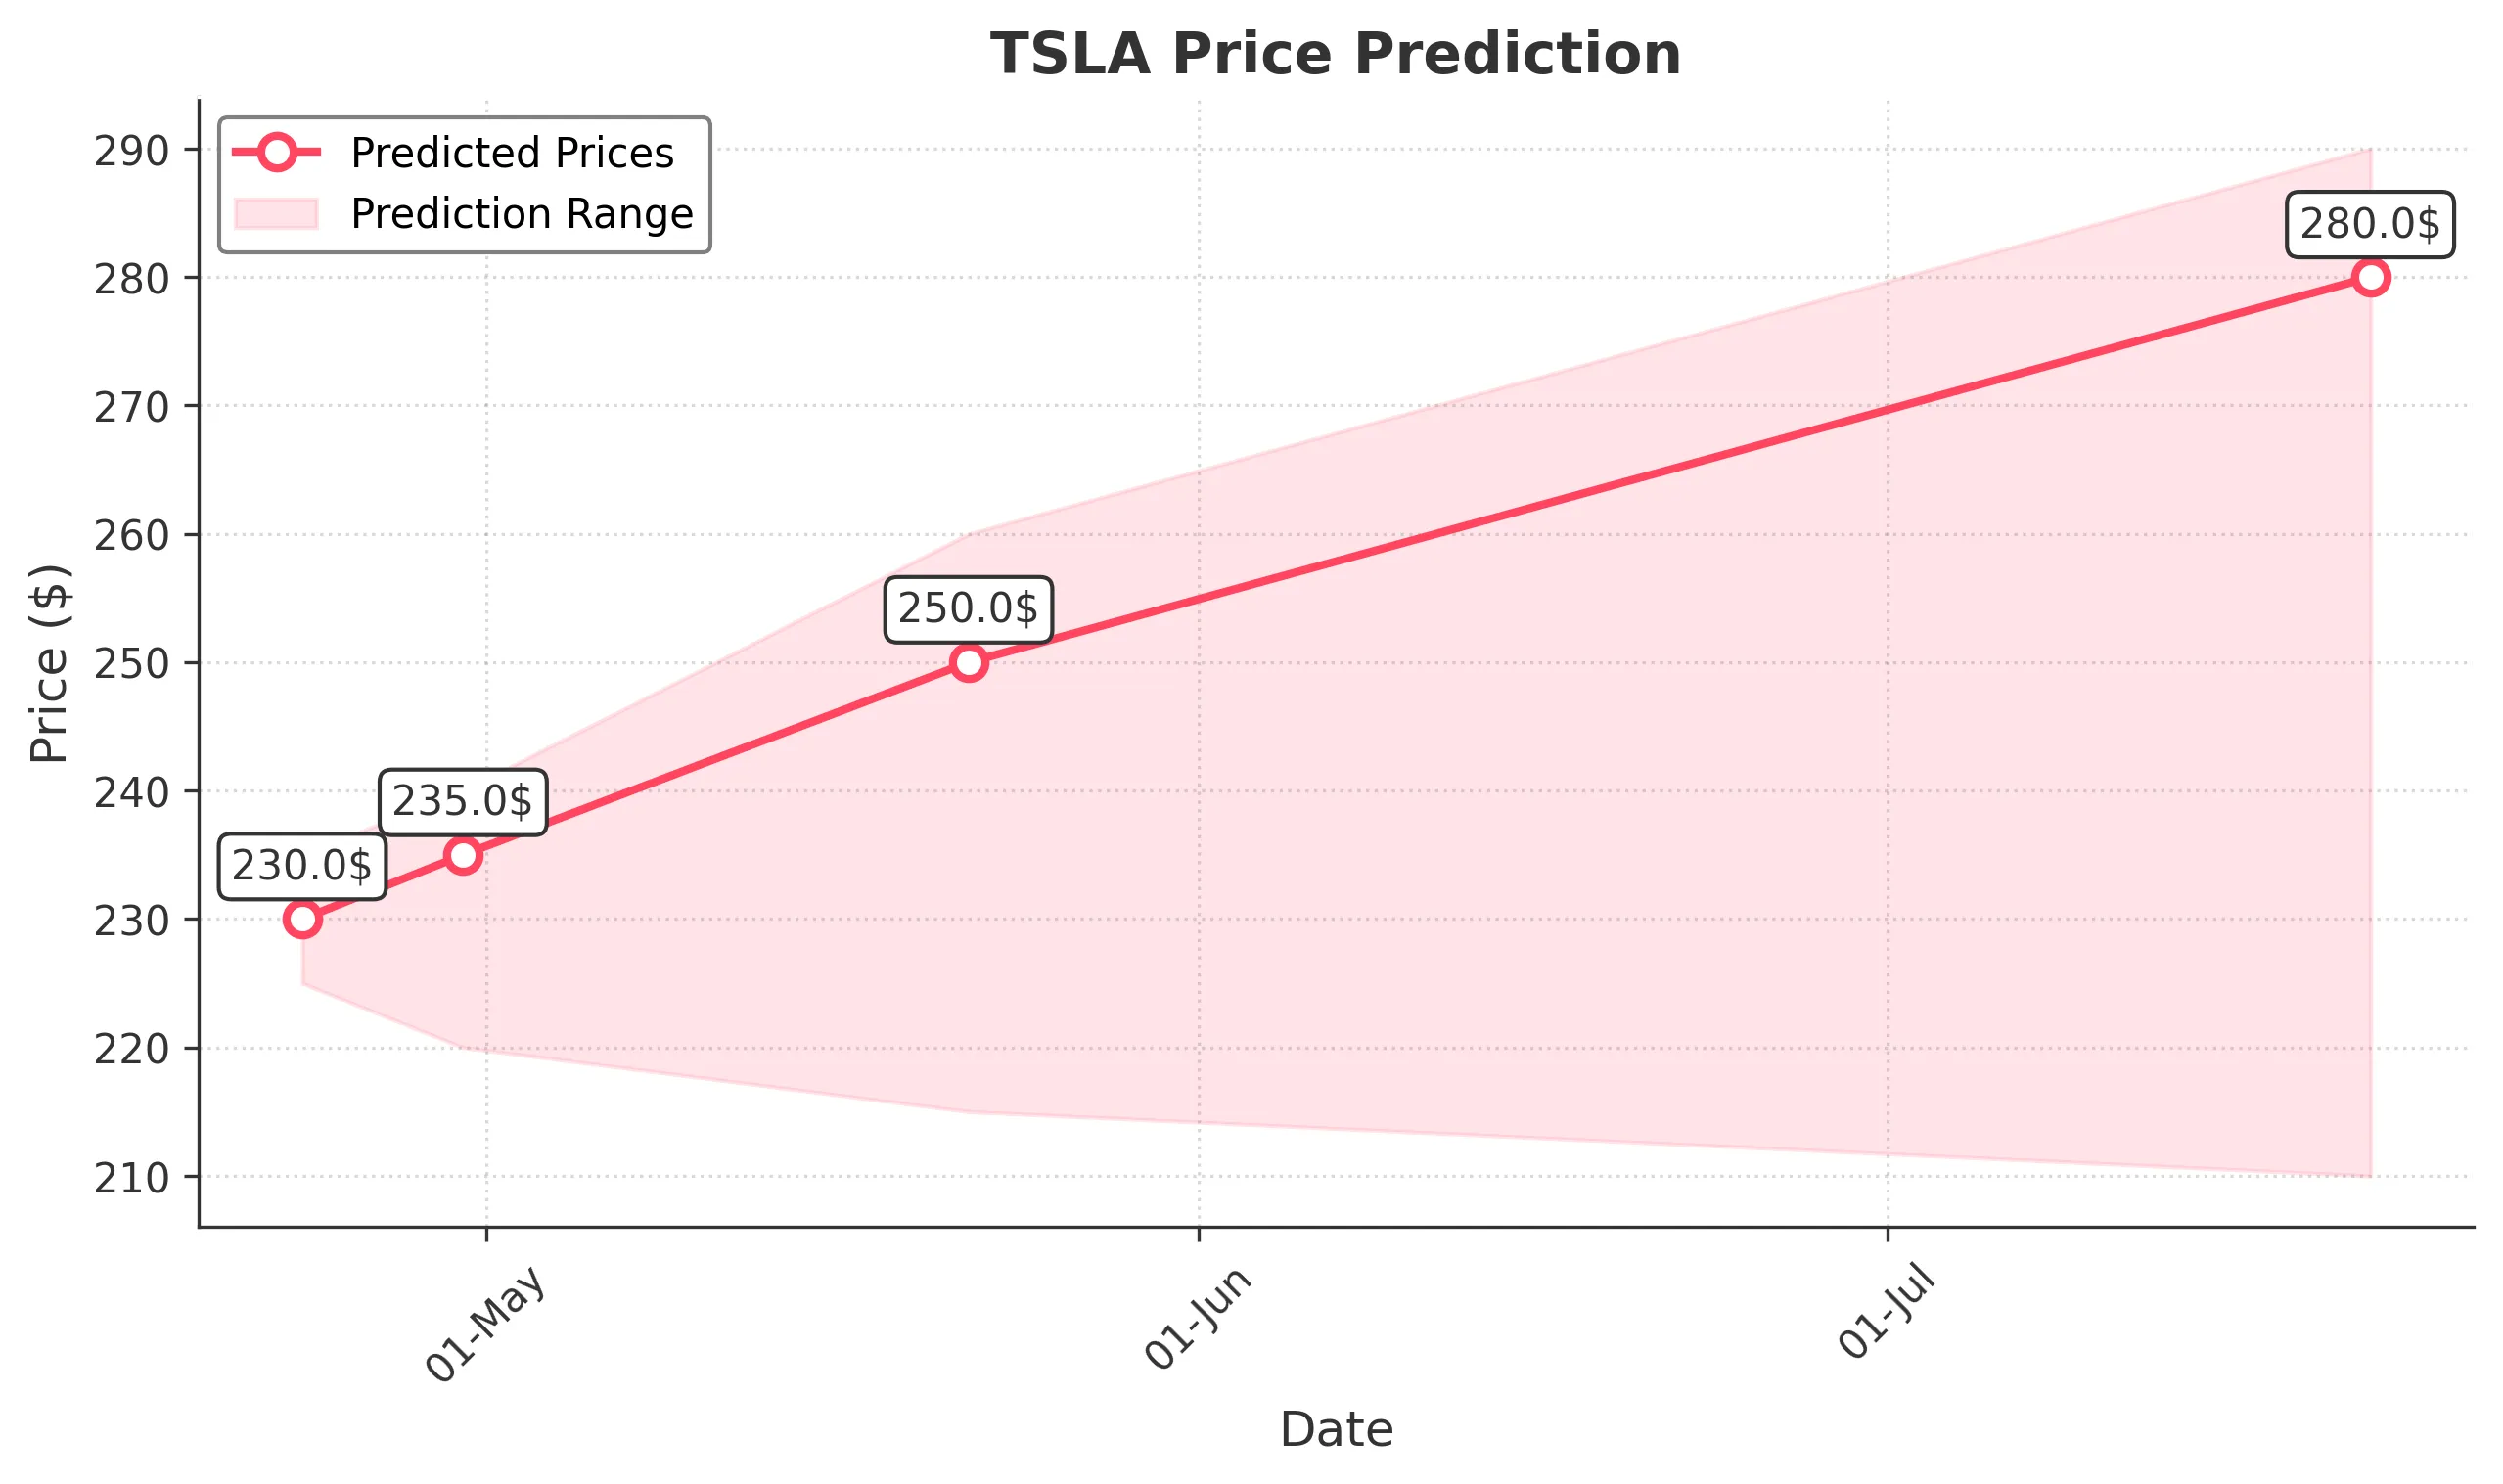
Target: April 23, 2025$230
$229
$235
$225
Description
The stock shows bearish momentum with a recent downtrend. RSI indicates oversold conditions, but MACD suggests potential for a slight rebound. Volume remains high, indicating strong selling pressure. Expect a close around 230.
Analysis
TSLA has been in a bearish trend over the past three months, with significant support around 225. Recent high volume on down days indicates strong selling pressure. Technical indicators like MACD and RSI suggest potential for a short-term bounce, but overall sentiment remains cautious.
Confidence Level
Potential Risks
Market volatility and external news could impact the prediction. A sudden bullish reversal is possible if sentiment shifts.
1 Week Prediction
Target: April 30, 2025$235
$230
$240
$220
Description
Expect a slight recovery as the stock may find support at 225. The RSI is improving, indicating potential for upward movement. However, resistance at 240 could limit gains. Volume trends suggest cautious optimism.
Analysis
The stock has shown signs of stabilization around 225, but the overall trend remains bearish. Key resistance at 240 needs to be monitored. Volume patterns indicate a potential for recovery, but external factors could influence price action.
Confidence Level
Potential Risks
Uncertainty in macroeconomic conditions and potential earnings reports could lead to volatility. A failure to break resistance at 240 may lead to further declines.
1 Month Prediction
Target: May 22, 2025$250
$240
$260
$215
Description
A gradual recovery is anticipated as the stock may test resistance levels. The MACD shows signs of bullish divergence, and RSI is moving towards neutral territory. Volume may increase as sentiment improves.
Analysis
The stock has been under pressure but shows potential for recovery. Key support at 215 and resistance at 260 will be critical. Technical indicators suggest a possible bullish reversal, but external factors remain a risk.
Confidence Level
Potential Risks
Market sentiment can shift quickly, and any negative news could derail the recovery. Watch for earnings reports that may impact investor confidence.
3 Months Prediction
Target: July 22, 2025$280
$270
$290
$210
Description
Longer-term outlook suggests a recovery towards 280 as market conditions stabilize. Positive earnings and macroeconomic factors could support this trend. However, volatility remains a concern.
Analysis
The stock has experienced significant volatility, with a bearish trend dominating the last three months. Key support at 210 and resistance at 290 will be pivotal. While there are signs of recovery, external factors could heavily influence future performance.
Confidence Level
Potential Risks
Potential for economic downturns or negative news could impact the stock significantly. The market's reaction to earnings and broader economic indicators will be crucial.