TSLA Trading Predictions
1 Day Prediction
Target: April 24, 2025$250
$248
$255
$245
Description
The stock shows a slight bullish trend with a potential bounce from recent support at 247. The RSI is near 40, indicating potential for upward movement. However, MACD is bearish, suggesting caution. Volume spikes may indicate increased interest.
Analysis
Over the past 3 months, TSLA has shown a bearish trend with significant drops. Key support at 247 has been tested. The RSI indicates oversold conditions, while MACD shows bearish momentum. Volume spikes suggest increased trading activity, but overall sentiment remains cautious.
Confidence Level
Potential Risks
Market volatility and external news could impact the prediction. A bearish reversal is possible if the support level fails.
1 Week Prediction
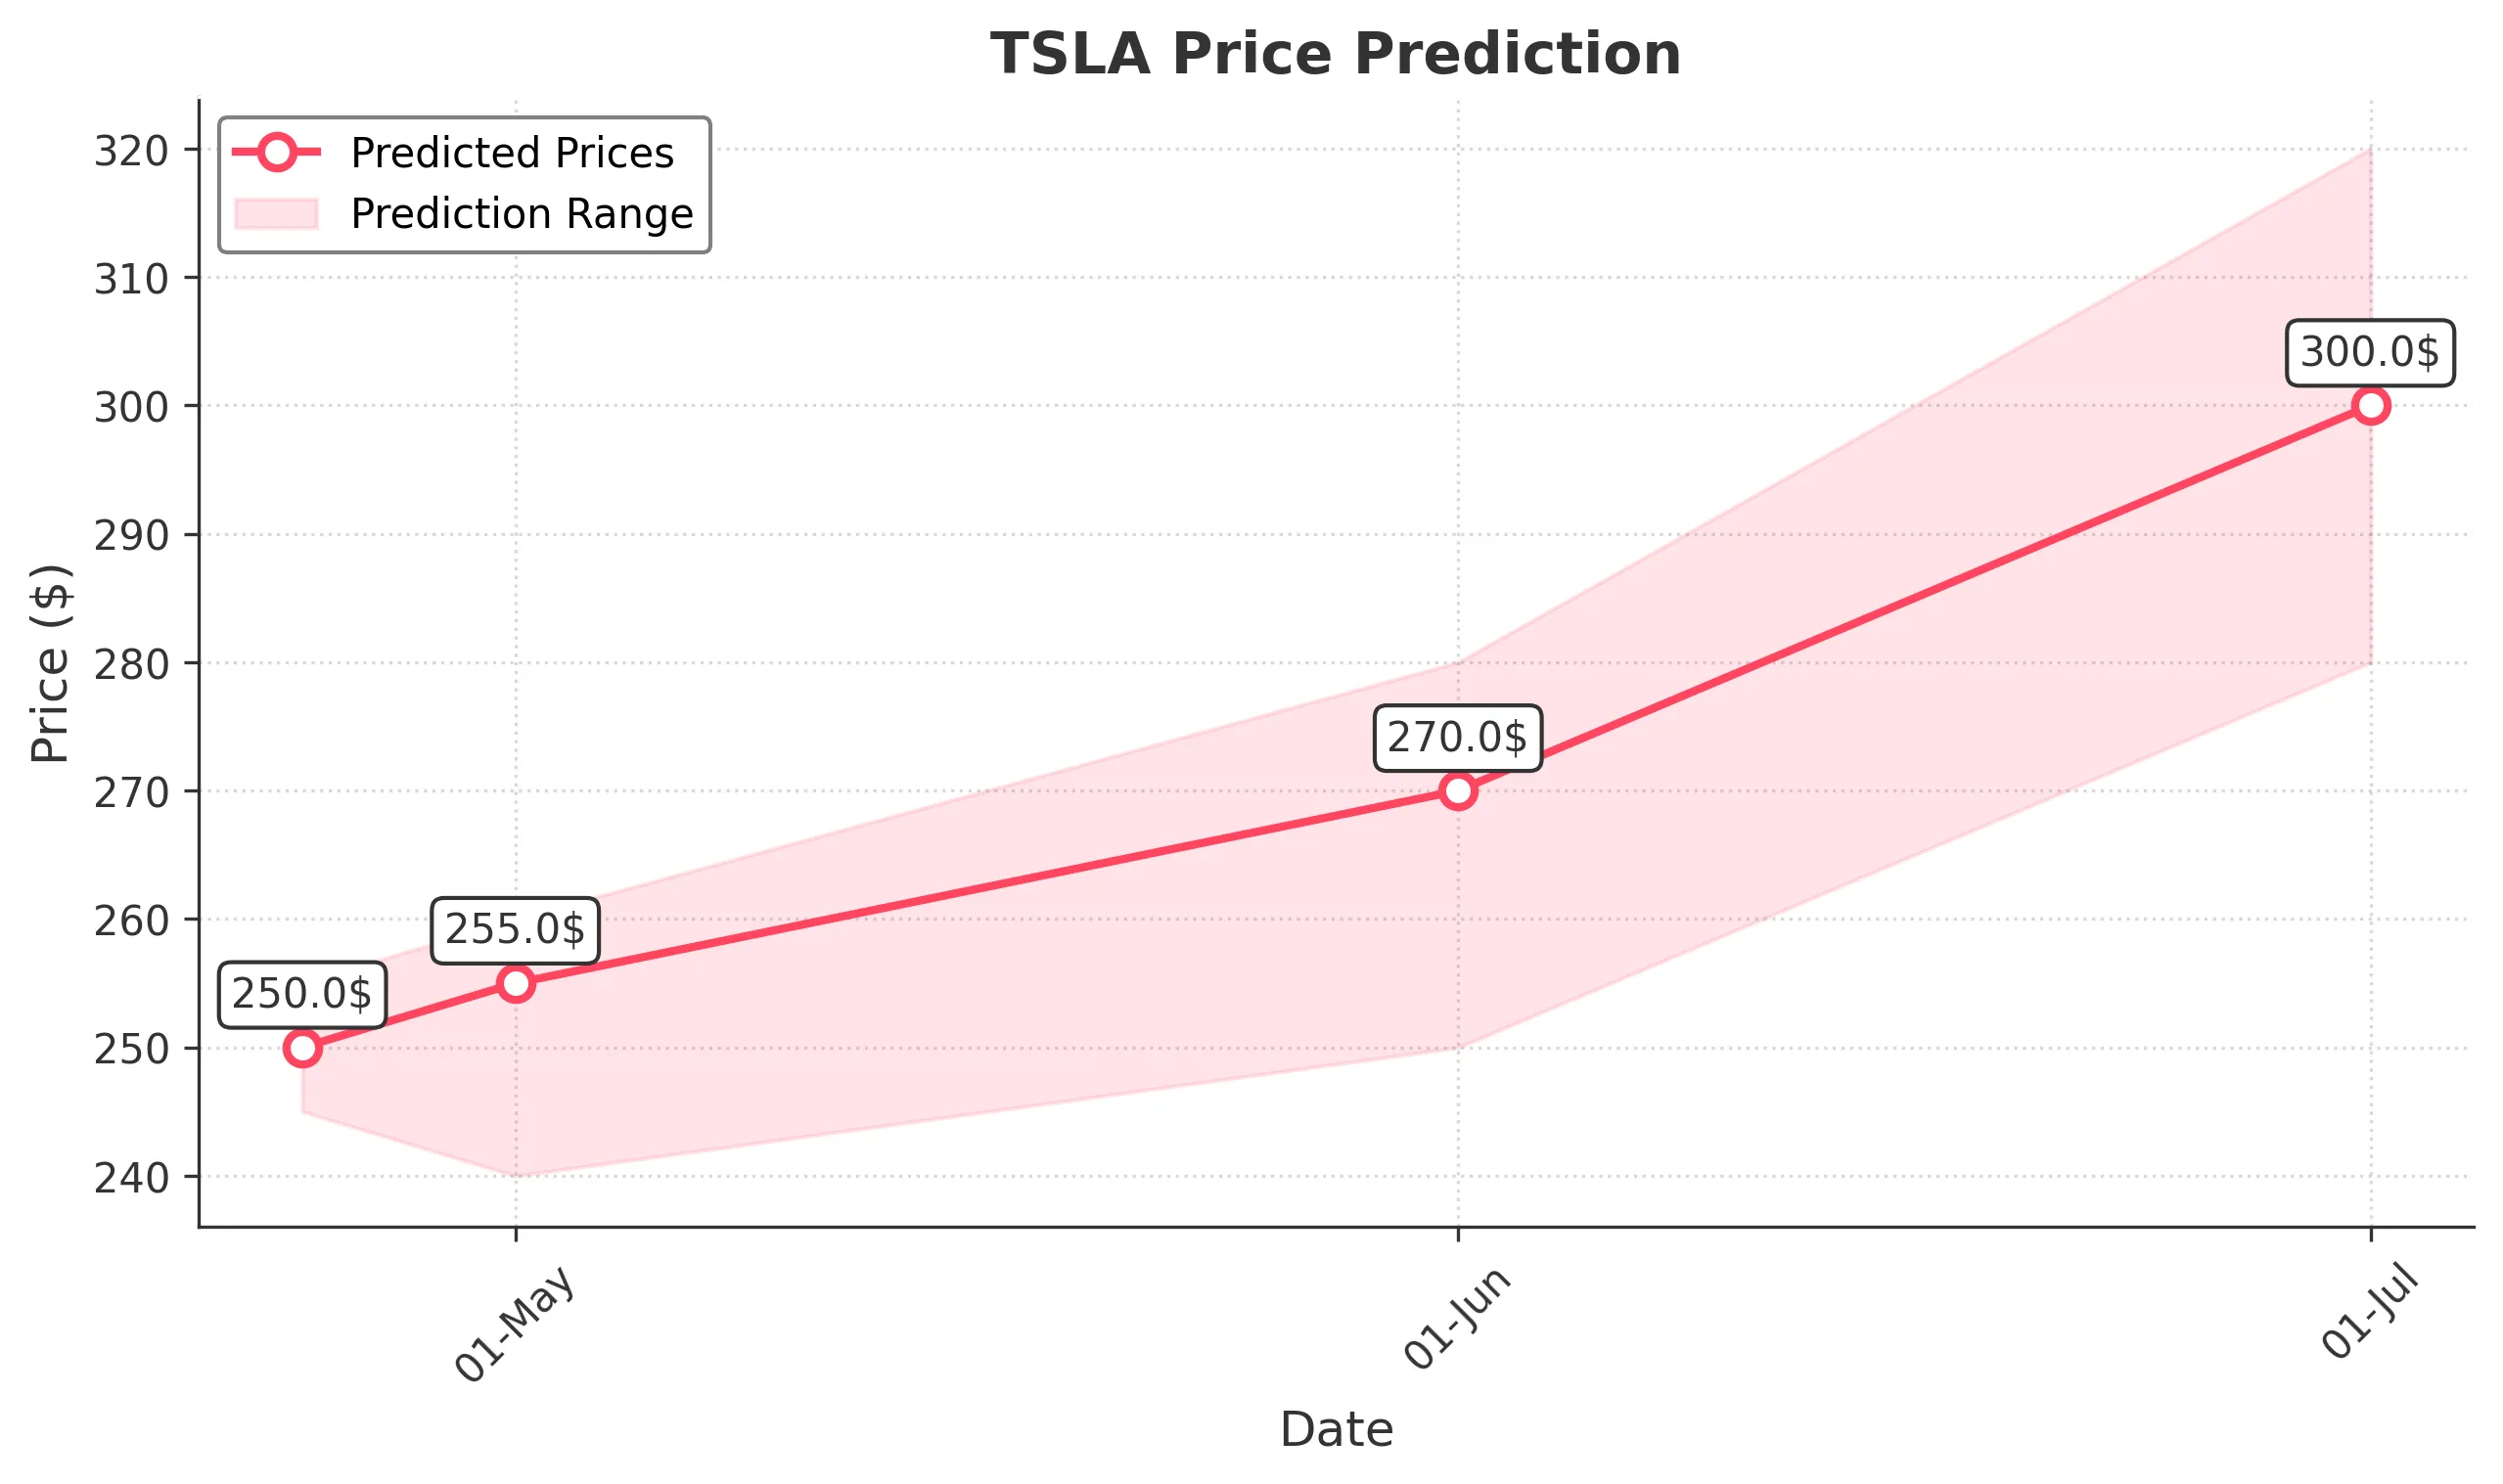
Target: May 1, 2025$255
$250
$260
$240
Description
A potential recovery is expected as the stock approaches resistance at 260. The recent candlestick patterns suggest indecision, but a bullish reversal could occur if momentum builds. Watch for volume trends to confirm.
Analysis
TSLA has been in a downtrend, with significant support at 247. The stock's performance has been volatile, with high trading volumes indicating uncertainty. Technical indicators show mixed signals, with potential for a short-term recovery if bullish momentum develops.
Confidence Level
Potential Risks
Unforeseen macroeconomic events or earnings reports could lead to volatility. The bearish trend may still dominate if resistance holds.
1 Month Prediction
Target: June 1, 2025$270
$260
$280
$250
Description
If the bullish momentum continues, TSLA could reach 270, testing resistance levels. The RSI may recover, indicating improved market sentiment. However, macroeconomic factors could still weigh heavily on the stock.
Analysis
The past three months have seen TSLA in a bearish phase, with significant price drops. Key support levels are being tested, and while there are signs of potential recovery, the overall market sentiment remains cautious. Technical indicators suggest a possible reversal, but risks remain.
Confidence Level
Potential Risks
Market sentiment is fragile, and any negative news could reverse the trend. The stock remains susceptible to broader market movements.
3 Months Prediction
Target: July 1, 2025$300
$290
$320
$280
Description
If the stock can break through resistance levels, a target of 300 is feasible. The market may stabilize, leading to increased investor confidence. However, external factors could still impact performance.
Analysis
TSLA's performance has been characterized by volatility and bearish trends. Key support levels are critical, and while there are signs of potential recovery, the overall market remains uncertain. Technical indicators show mixed signals, and external factors could heavily influence future performance.
Confidence Level
Potential Risks
Long-term predictions are uncertain due to potential market shifts and economic conditions. A bearish trend could persist if negative sentiment continues.