TSLA Trading Predictions
1 Day Prediction
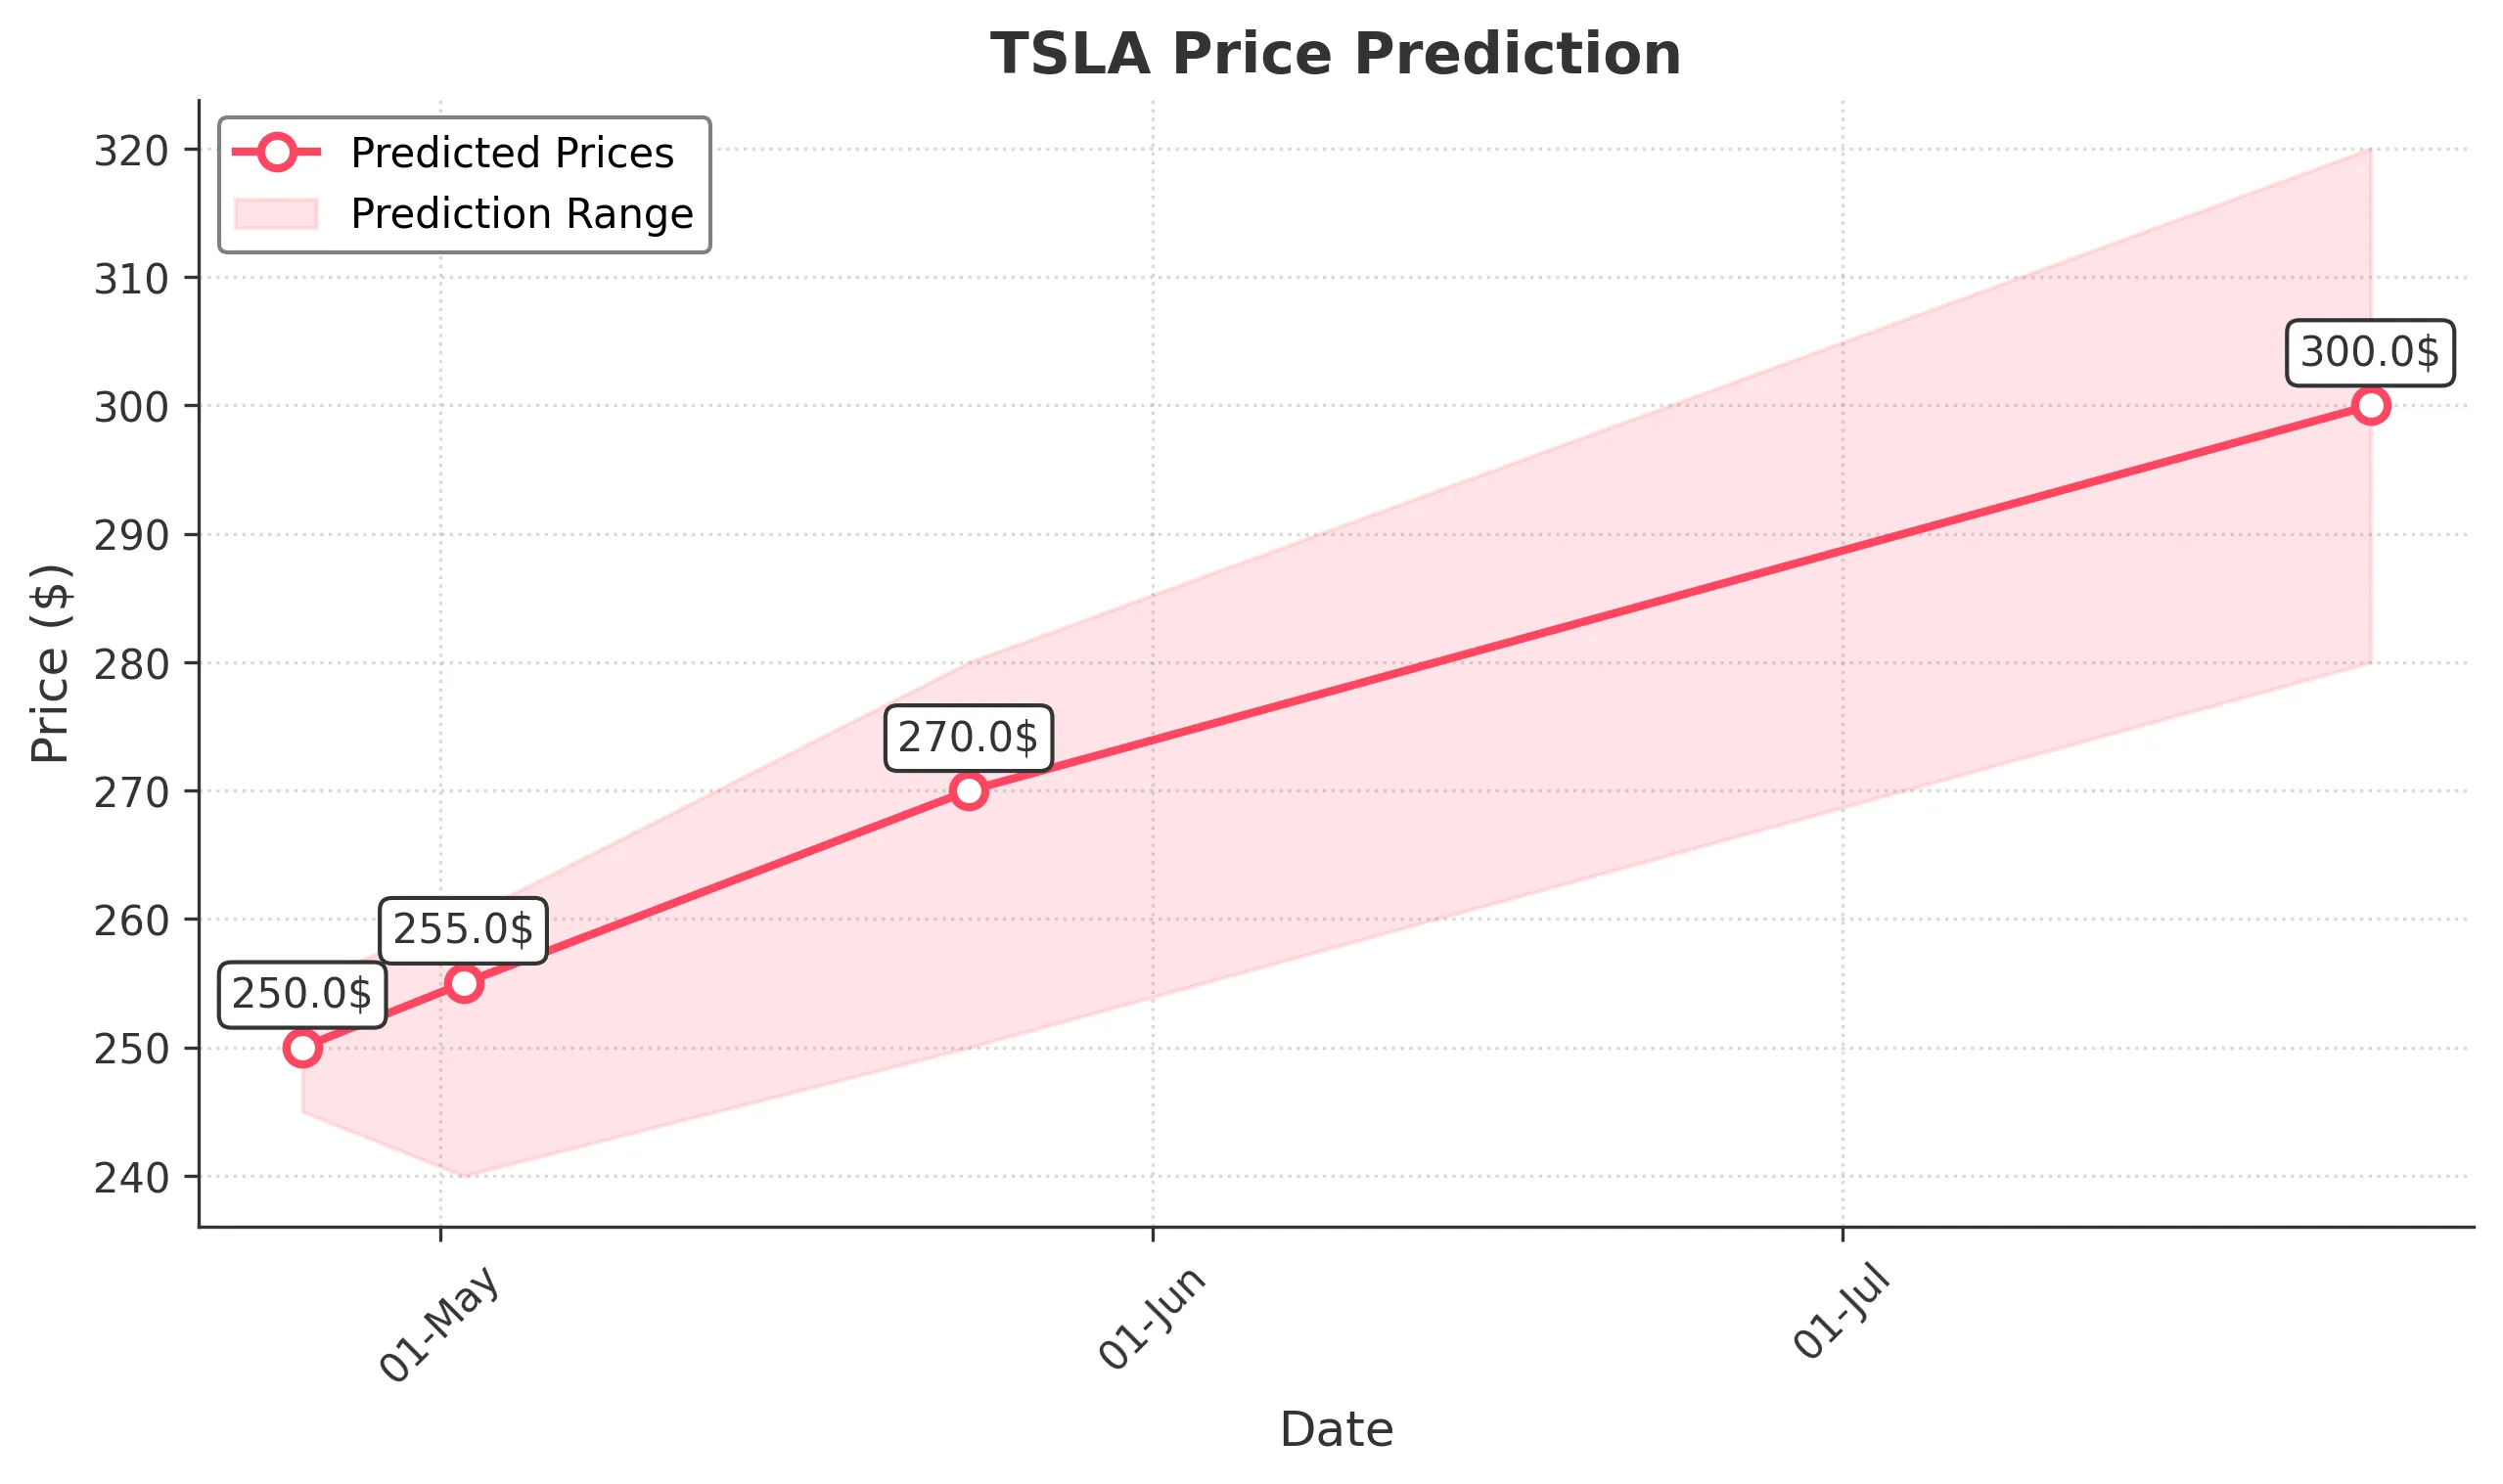
Target: April 25, 2025$250
$248
$255
$245
Description
The stock shows signs of a potential bounce after recent declines, supported by a slight bullish divergence in RSI. However, resistance at 255 may limit upside. Volume spikes indicate increased interest, but overall sentiment remains cautious.
Analysis
TSLA has been in a bearish trend over the past three months, with significant support around 240. Recent volume spikes suggest potential accumulation, but resistance levels at 255 and 260 remain critical. Technical indicators show mixed signals, with MACD indicating potential bullish momentum, while RSI suggests overbought conditions.
Confidence Level
Potential Risks
Market volatility and external news could impact price movements significantly.
1 Week Prediction
Target: May 2, 2025$255
$250
$260
$240
Description
A potential recovery is expected as the stock approaches key support levels. The MACD shows a bullish crossover, and RSI is stabilizing. However, resistance at 260 could pose challenges, and market sentiment remains mixed.
Analysis
The stock has shown a bearish trend, with significant support at 240. Recent price action indicates a possible reversal, but resistance at 260 is a concern. Technical indicators are mixed, with MACD showing bullish potential, while volume patterns suggest cautious accumulation.
Confidence Level
Potential Risks
Unforeseen macroeconomic events or earnings reports could lead to volatility.
1 Month Prediction
Target: May 24, 2025$270
$260
$280
$250
Description
If the bullish momentum continues, TSLA could reach 270, supported by improving market sentiment. However, resistance at 280 may limit gains. Watch for volume trends as they could indicate strength or weakness.
Analysis
The stock has been in a bearish phase, but recent signs of recovery could lead to a bullish reversal. Key resistance at 280 and support at 240 are critical levels. Technical indicators show potential for upward movement, but overall market sentiment remains uncertain.
Confidence Level
Potential Risks
Market conditions and external factors could lead to unexpected price movements.
3 Months Prediction
Target: July 24, 2025$300
$290
$320
$280
Description
If the current recovery trend continues, TSLA could reach 300, driven by positive market sentiment and potential product announcements. However, resistance at 320 may pose challenges.
Analysis
The stock has shown a bearish trend but may be entering a recovery phase. Key resistance at 320 and support at 240 are critical. Technical indicators suggest potential for upward movement, but external factors could significantly impact performance.
Confidence Level
Potential Risks
Long-term predictions are subject to significant uncertainty due to market volatility and external economic factors.