TSLA Trading Predictions
1 Day Prediction
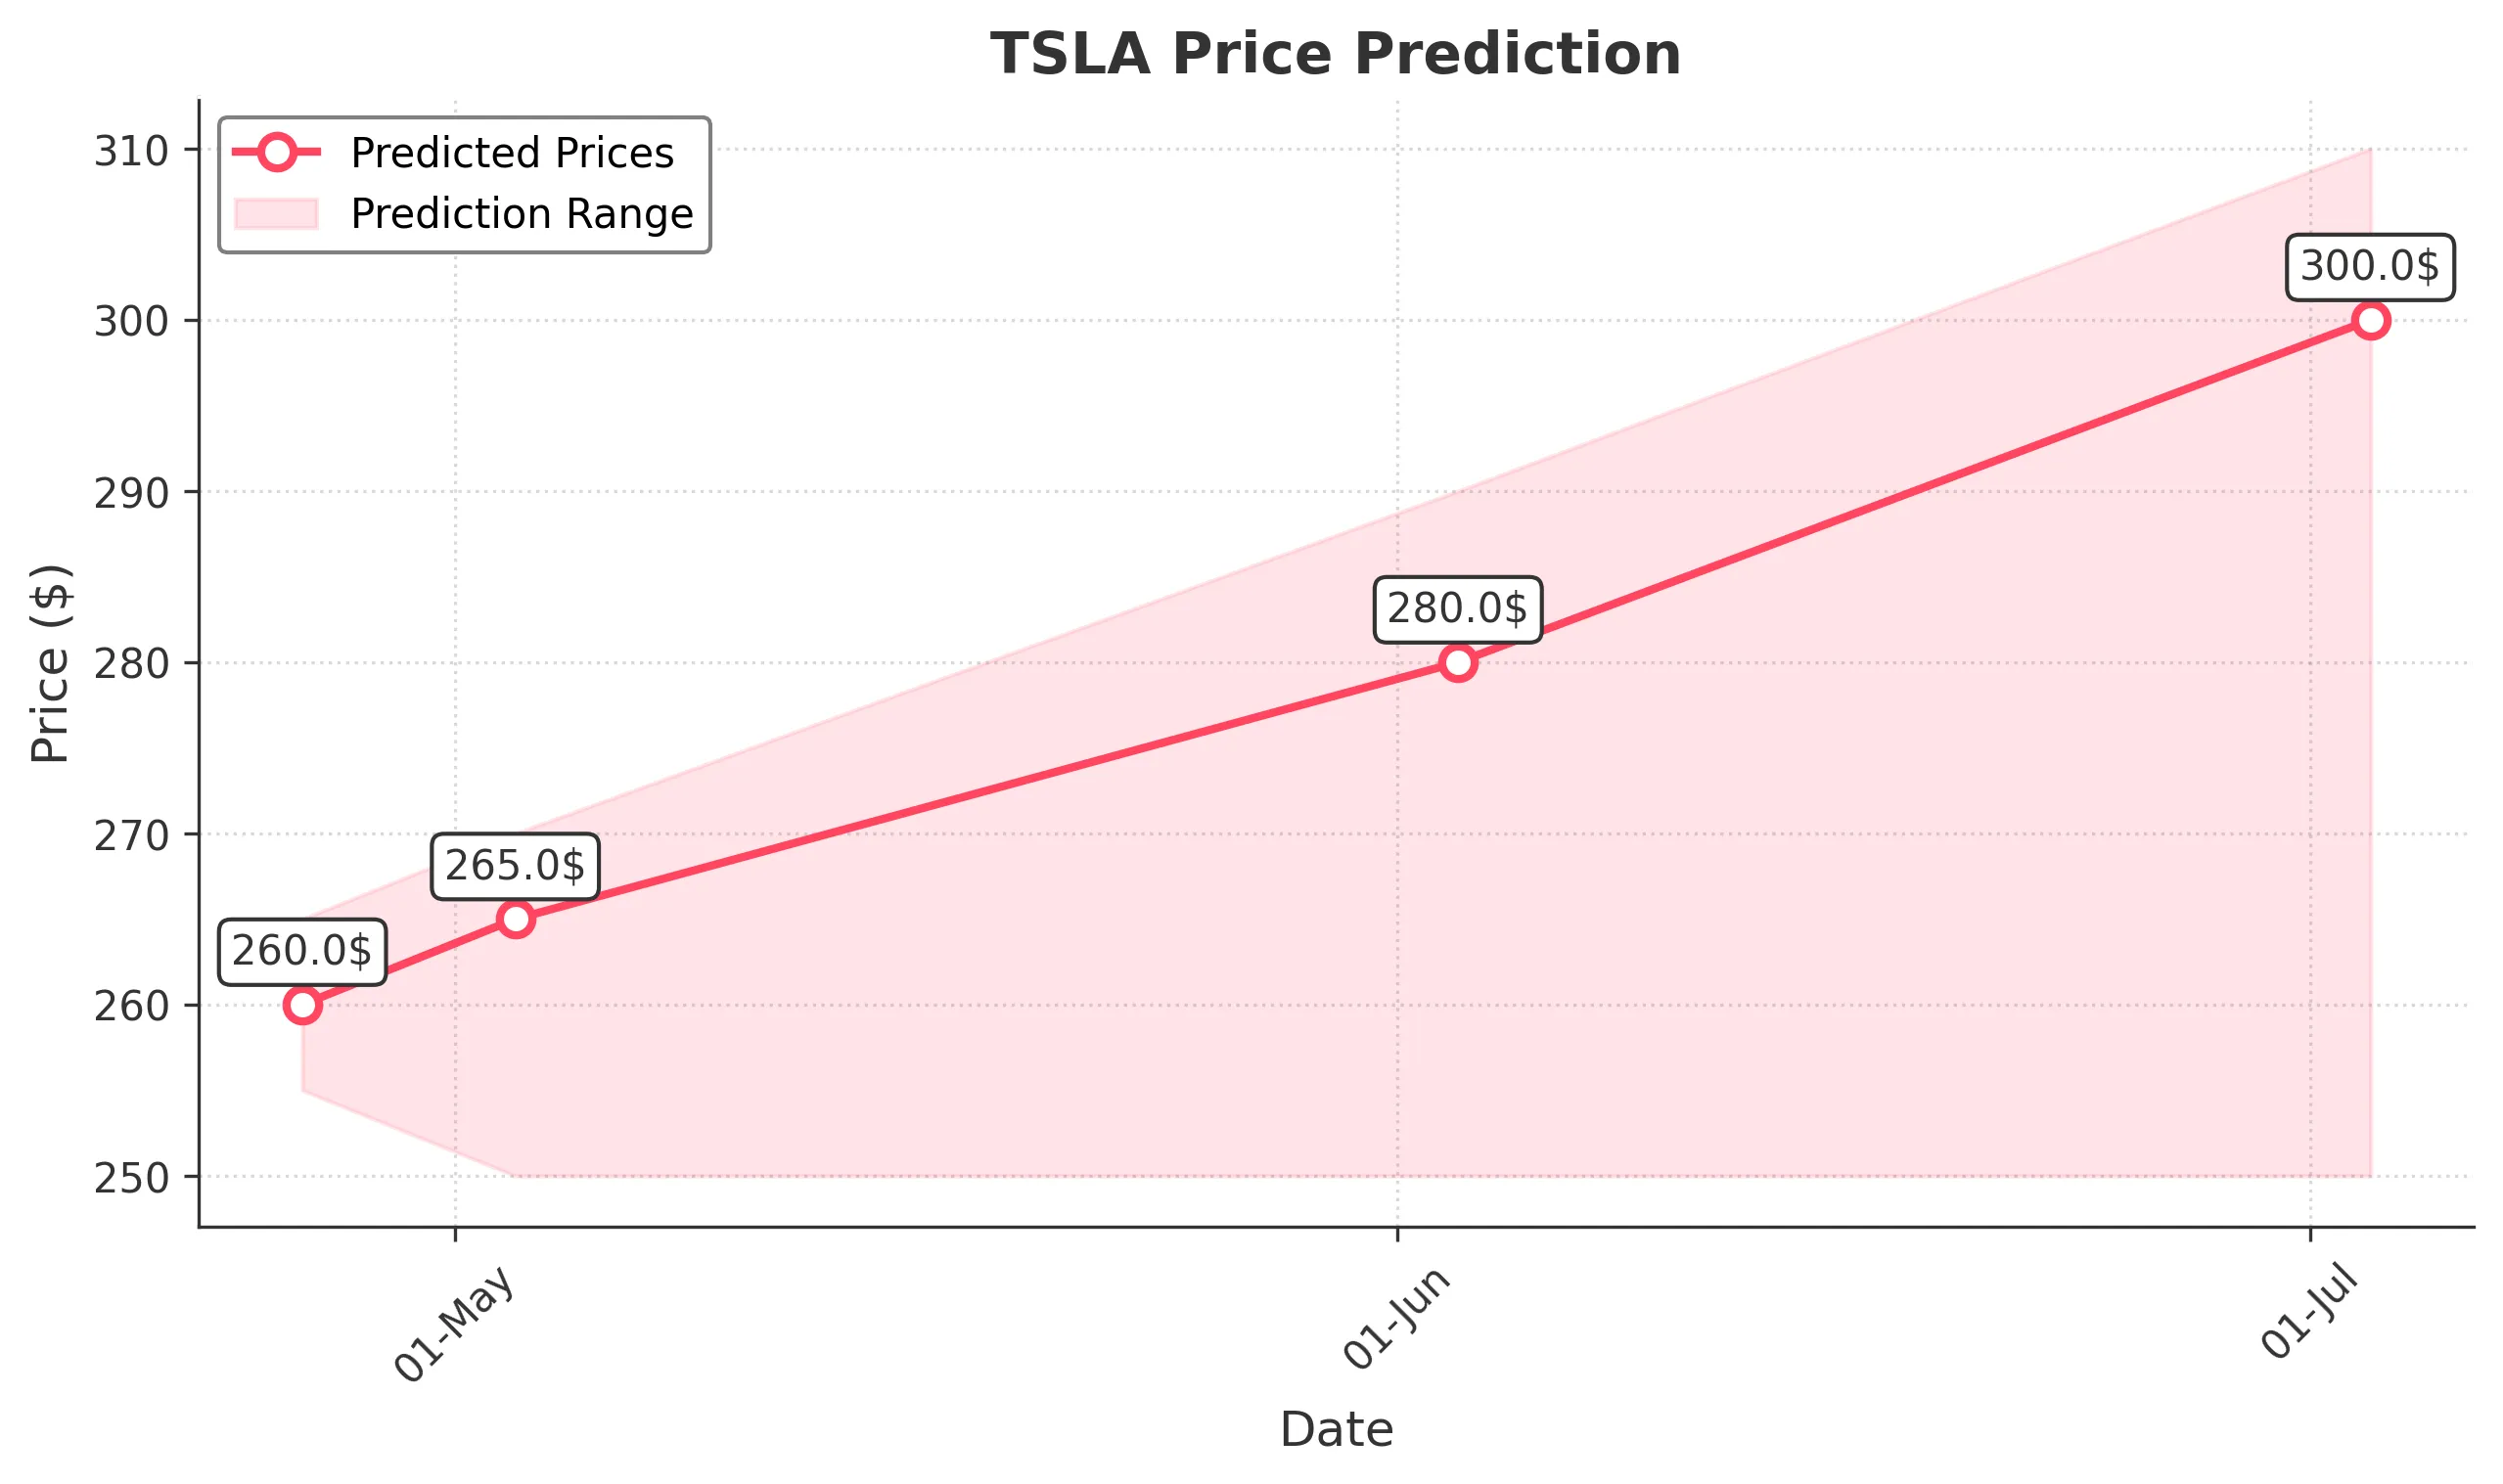
Target: April 26, 2025$260
$261
$265
$255
Description
The stock shows a slight recovery trend after recent declines. RSI indicates oversold conditions, suggesting a potential bounce. However, resistance at 265 may limit upside. Volume remains moderate, indicating cautious sentiment.
Analysis
TSLA has been in a bearish trend over the past three months, with significant support around 250. Recent volume spikes indicate increased selling pressure. Technical indicators like MACD are bearish, but RSI suggests potential for a short-term rebound.
Confidence Level
Potential Risks
Market volatility and external news could impact the prediction. A failure to break resistance may lead to further declines.
1 Week Prediction
Target: May 3, 2025$265
$262
$270
$250
Description
A potential short-term recovery is expected as the stock approaches key support levels. The MACD shows signs of convergence, indicating a possible bullish reversal. However, resistance at 270 remains a concern.
Analysis
The stock has faced significant selling pressure, with key support at 250. Recent candlestick patterns show indecision, and while there are signs of a potential reversal, the overall trend remains bearish.
Confidence Level
Potential Risks
Uncertainty in market sentiment and macroeconomic factors could lead to unexpected volatility. A break below 250 would signal further bearish momentum.
1 Month Prediction
Target: June 3, 2025$280
$270
$290
$250
Description
If the stock can maintain above 250, a gradual recovery towards 280 is plausible. The RSI may stabilize, and if bullish momentum builds, we could see a test of 290. However, macroeconomic factors remain a risk.
Analysis
The stock has been volatile, with a bearish trend dominating. Key support at 250 is critical, and while there are signs of potential recovery, the overall market sentiment remains cautious.
Confidence Level
Potential Risks
Potential for further declines if market sentiment worsens. Economic indicators and earnings reports could significantly impact performance.
3 Months Prediction
Target: July 3, 2025$300
$290
$310
$250
Description
If the stock can break above 290, a bullish trend may develop, targeting 300. The MACD could turn positive, indicating a shift in momentum. However, external economic factors could pose risks.
Analysis
The stock's performance has been characterized by significant volatility and bearish trends. Key resistance levels will be crucial in determining future price movements, and macroeconomic conditions will play a significant role.
Confidence Level
Potential Risks
Market volatility and potential negative news could derail recovery efforts. A failure to hold above 250 would indicate further downside risk.