TSLA Trading Predictions
1 Day Prediction
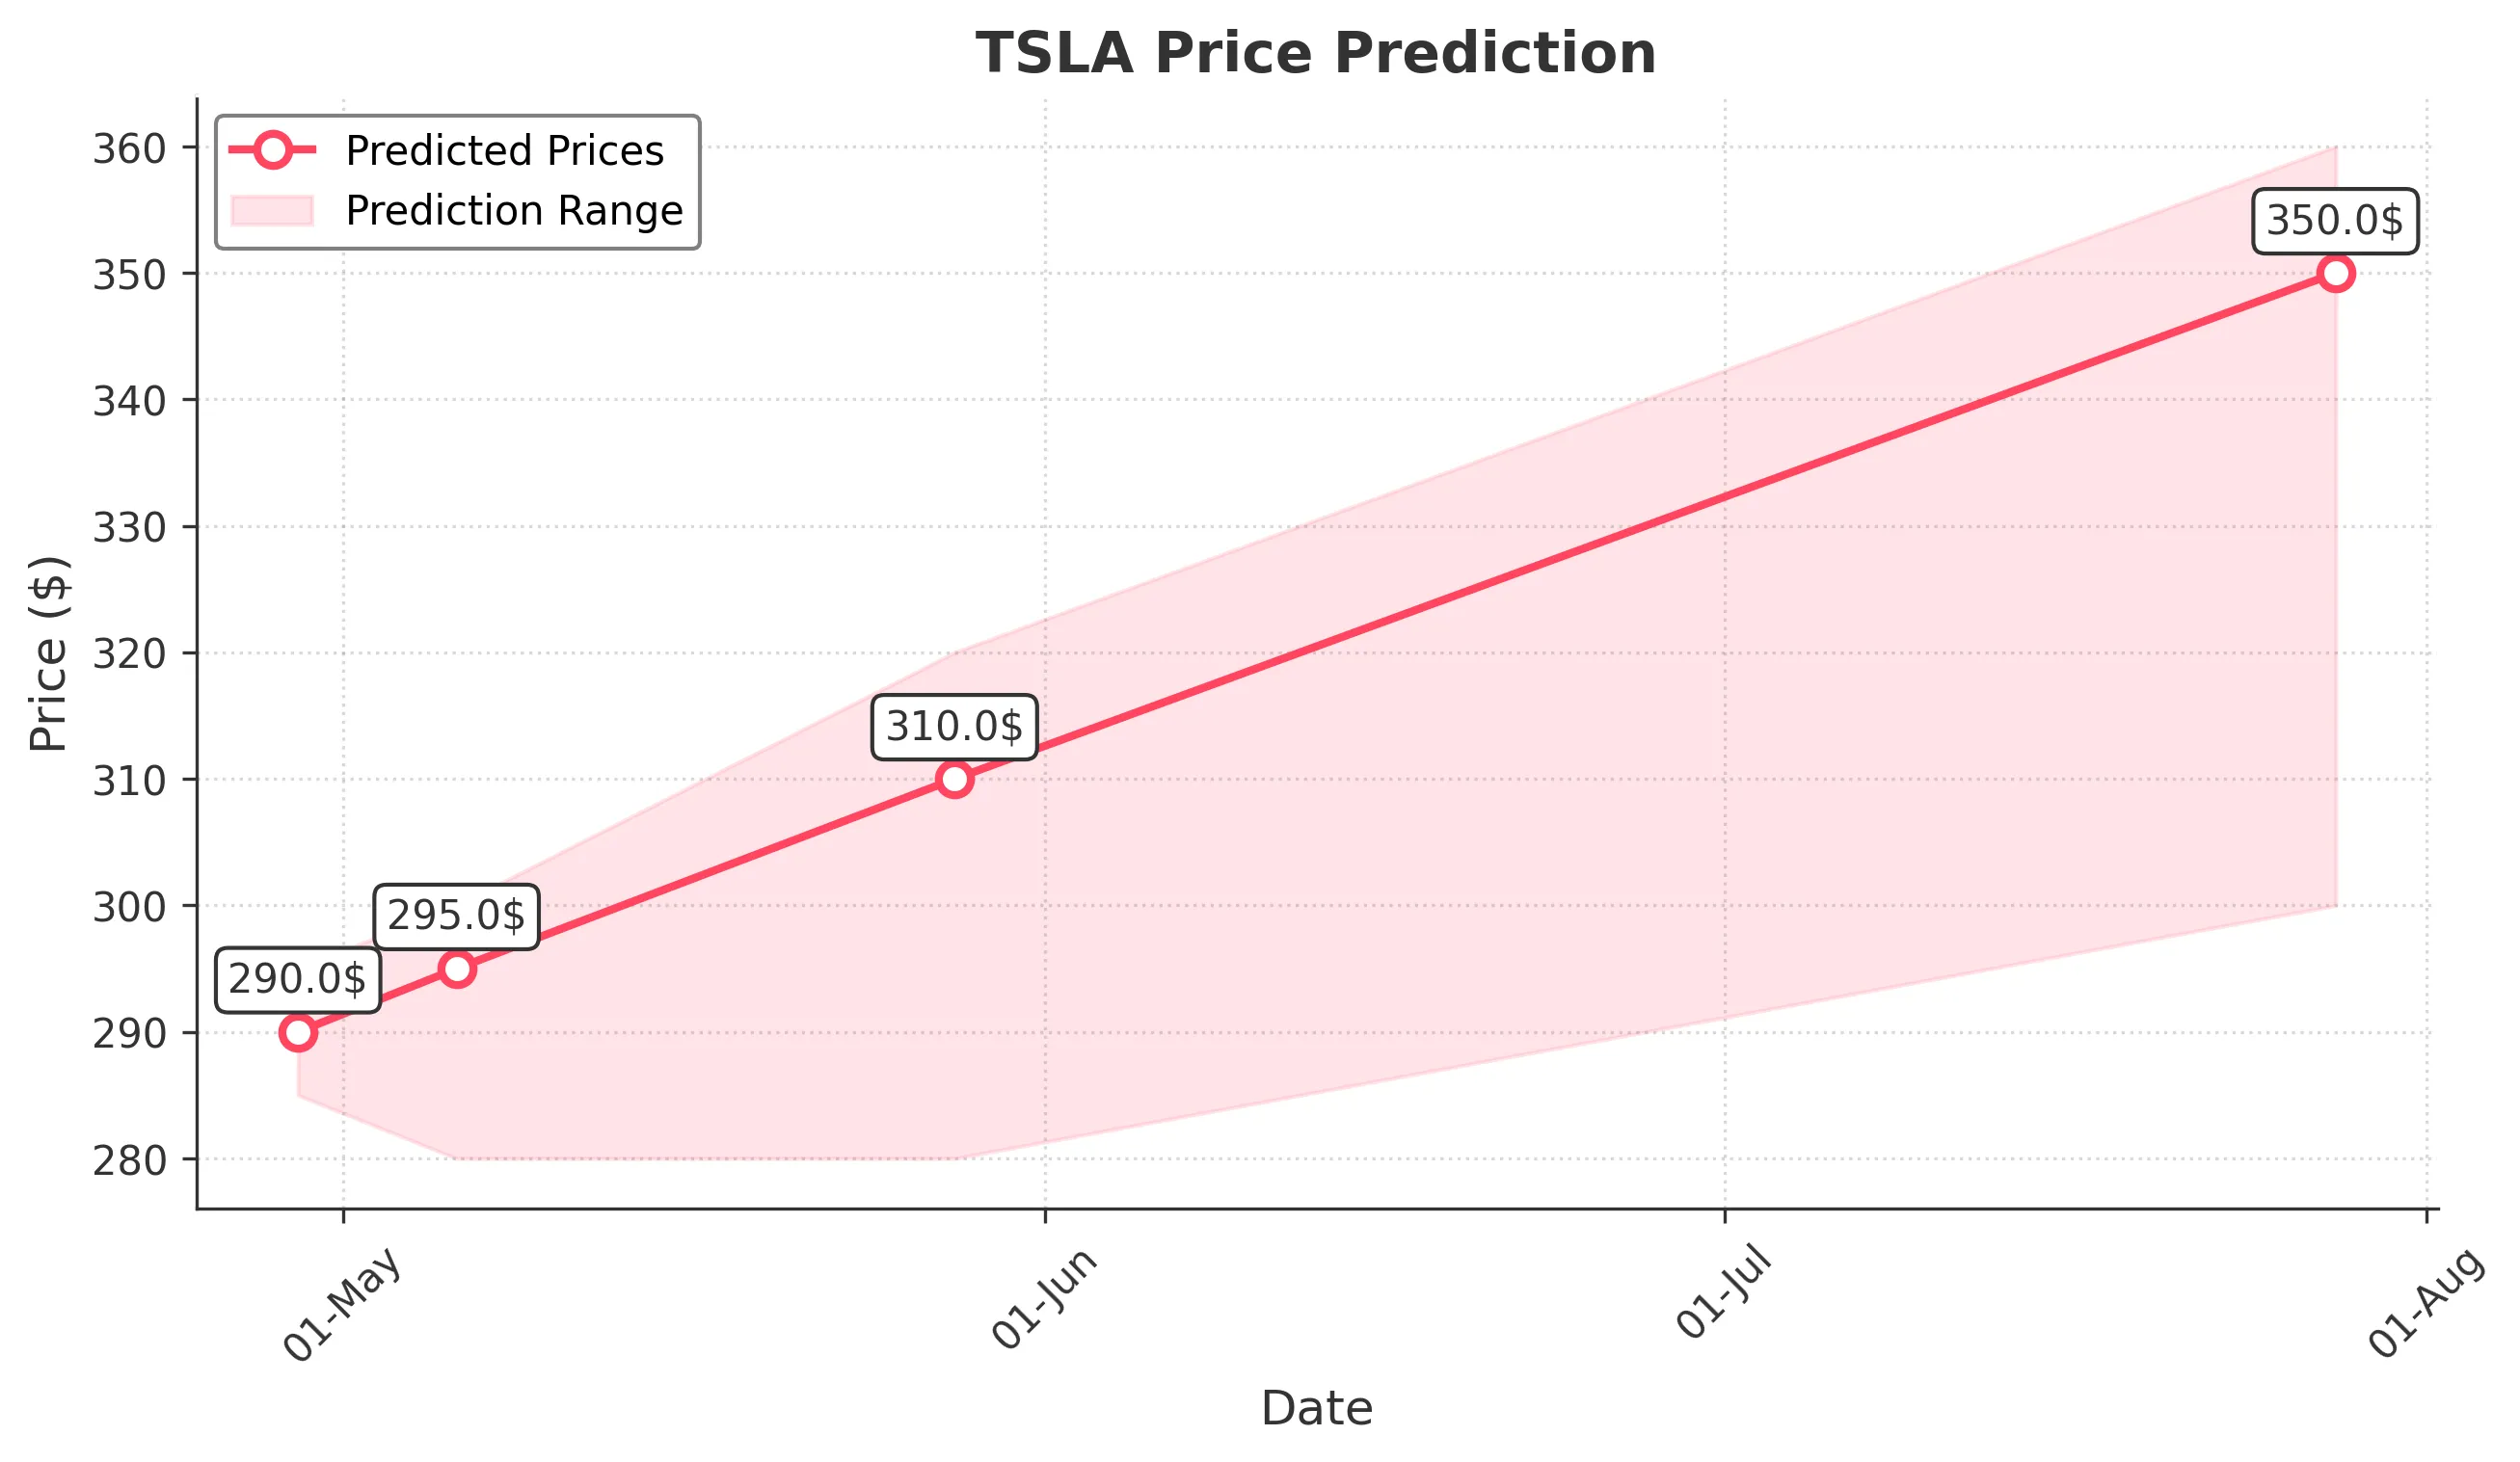
Target: April 29, 2025$290
$288
$295
$285
Description
The stock shows a slight bullish trend with a potential bounce from recent lows. RSI indicates oversold conditions, while MACD is showing a bullish crossover. However, volatility remains high, suggesting caution.
Analysis
Over the past 3 months, TSLA has experienced significant volatility, with a bearish trend leading to lower lows. Key support is around 250, while resistance is near 300. Volume spikes indicate strong interest, but overall sentiment remains cautious.
Confidence Level
Potential Risks
Market sentiment can shift quickly, and external news could impact the stock's performance significantly.
1 Week Prediction
Target: May 6, 2025$295
$290
$300
$280
Description
A potential recovery is indicated as the stock approaches key resistance levels. The recent bullish candlestick patterns suggest a reversal, but the overall market sentiment remains mixed, which could limit upside.
Analysis
The stock has shown a bearish trend recently, with significant support at 250. Technical indicators suggest a possible reversal, but the overall market remains uncertain. Volume patterns indicate increased trading activity, which could lead to further price movements.
Confidence Level
Potential Risks
Unforeseen macroeconomic events or earnings reports could lead to volatility, impacting the prediction.
1 Month Prediction
Target: May 28, 2025$310
$295
$320
$280
Description
If the bullish momentum continues, TSLA could reach higher levels. The MACD shows potential for upward movement, and RSI is recovering. However, resistance at 320 may pose challenges.
Analysis
The stock has been in a bearish phase but shows signs of recovery. Key resistance at 320 and support at 250 are critical levels. Technical indicators suggest a potential upward trend, but market sentiment remains cautious.
Confidence Level
Potential Risks
Market volatility and external factors could hinder the predicted upward trend, leading to potential pullbacks.
3 Months Prediction
Target: July 28, 2025$350
$340
$360
$300
Description
If the current recovery trend continues, TSLA could reach 350. The bullish patterns and improving RSI suggest a positive outlook, but macroeconomic factors could impact this trajectory.
Analysis
The stock has shown significant volatility, with a bearish trend recently. Key support at 250 and resistance at 320 are crucial. While technical indicators suggest a potential recovery, external factors could significantly influence future performance.
Confidence Level
Potential Risks
Long-term predictions are subject to greater uncertainty due to potential market shifts and economic conditions.