TSLA Trading Predictions
1 Day Prediction
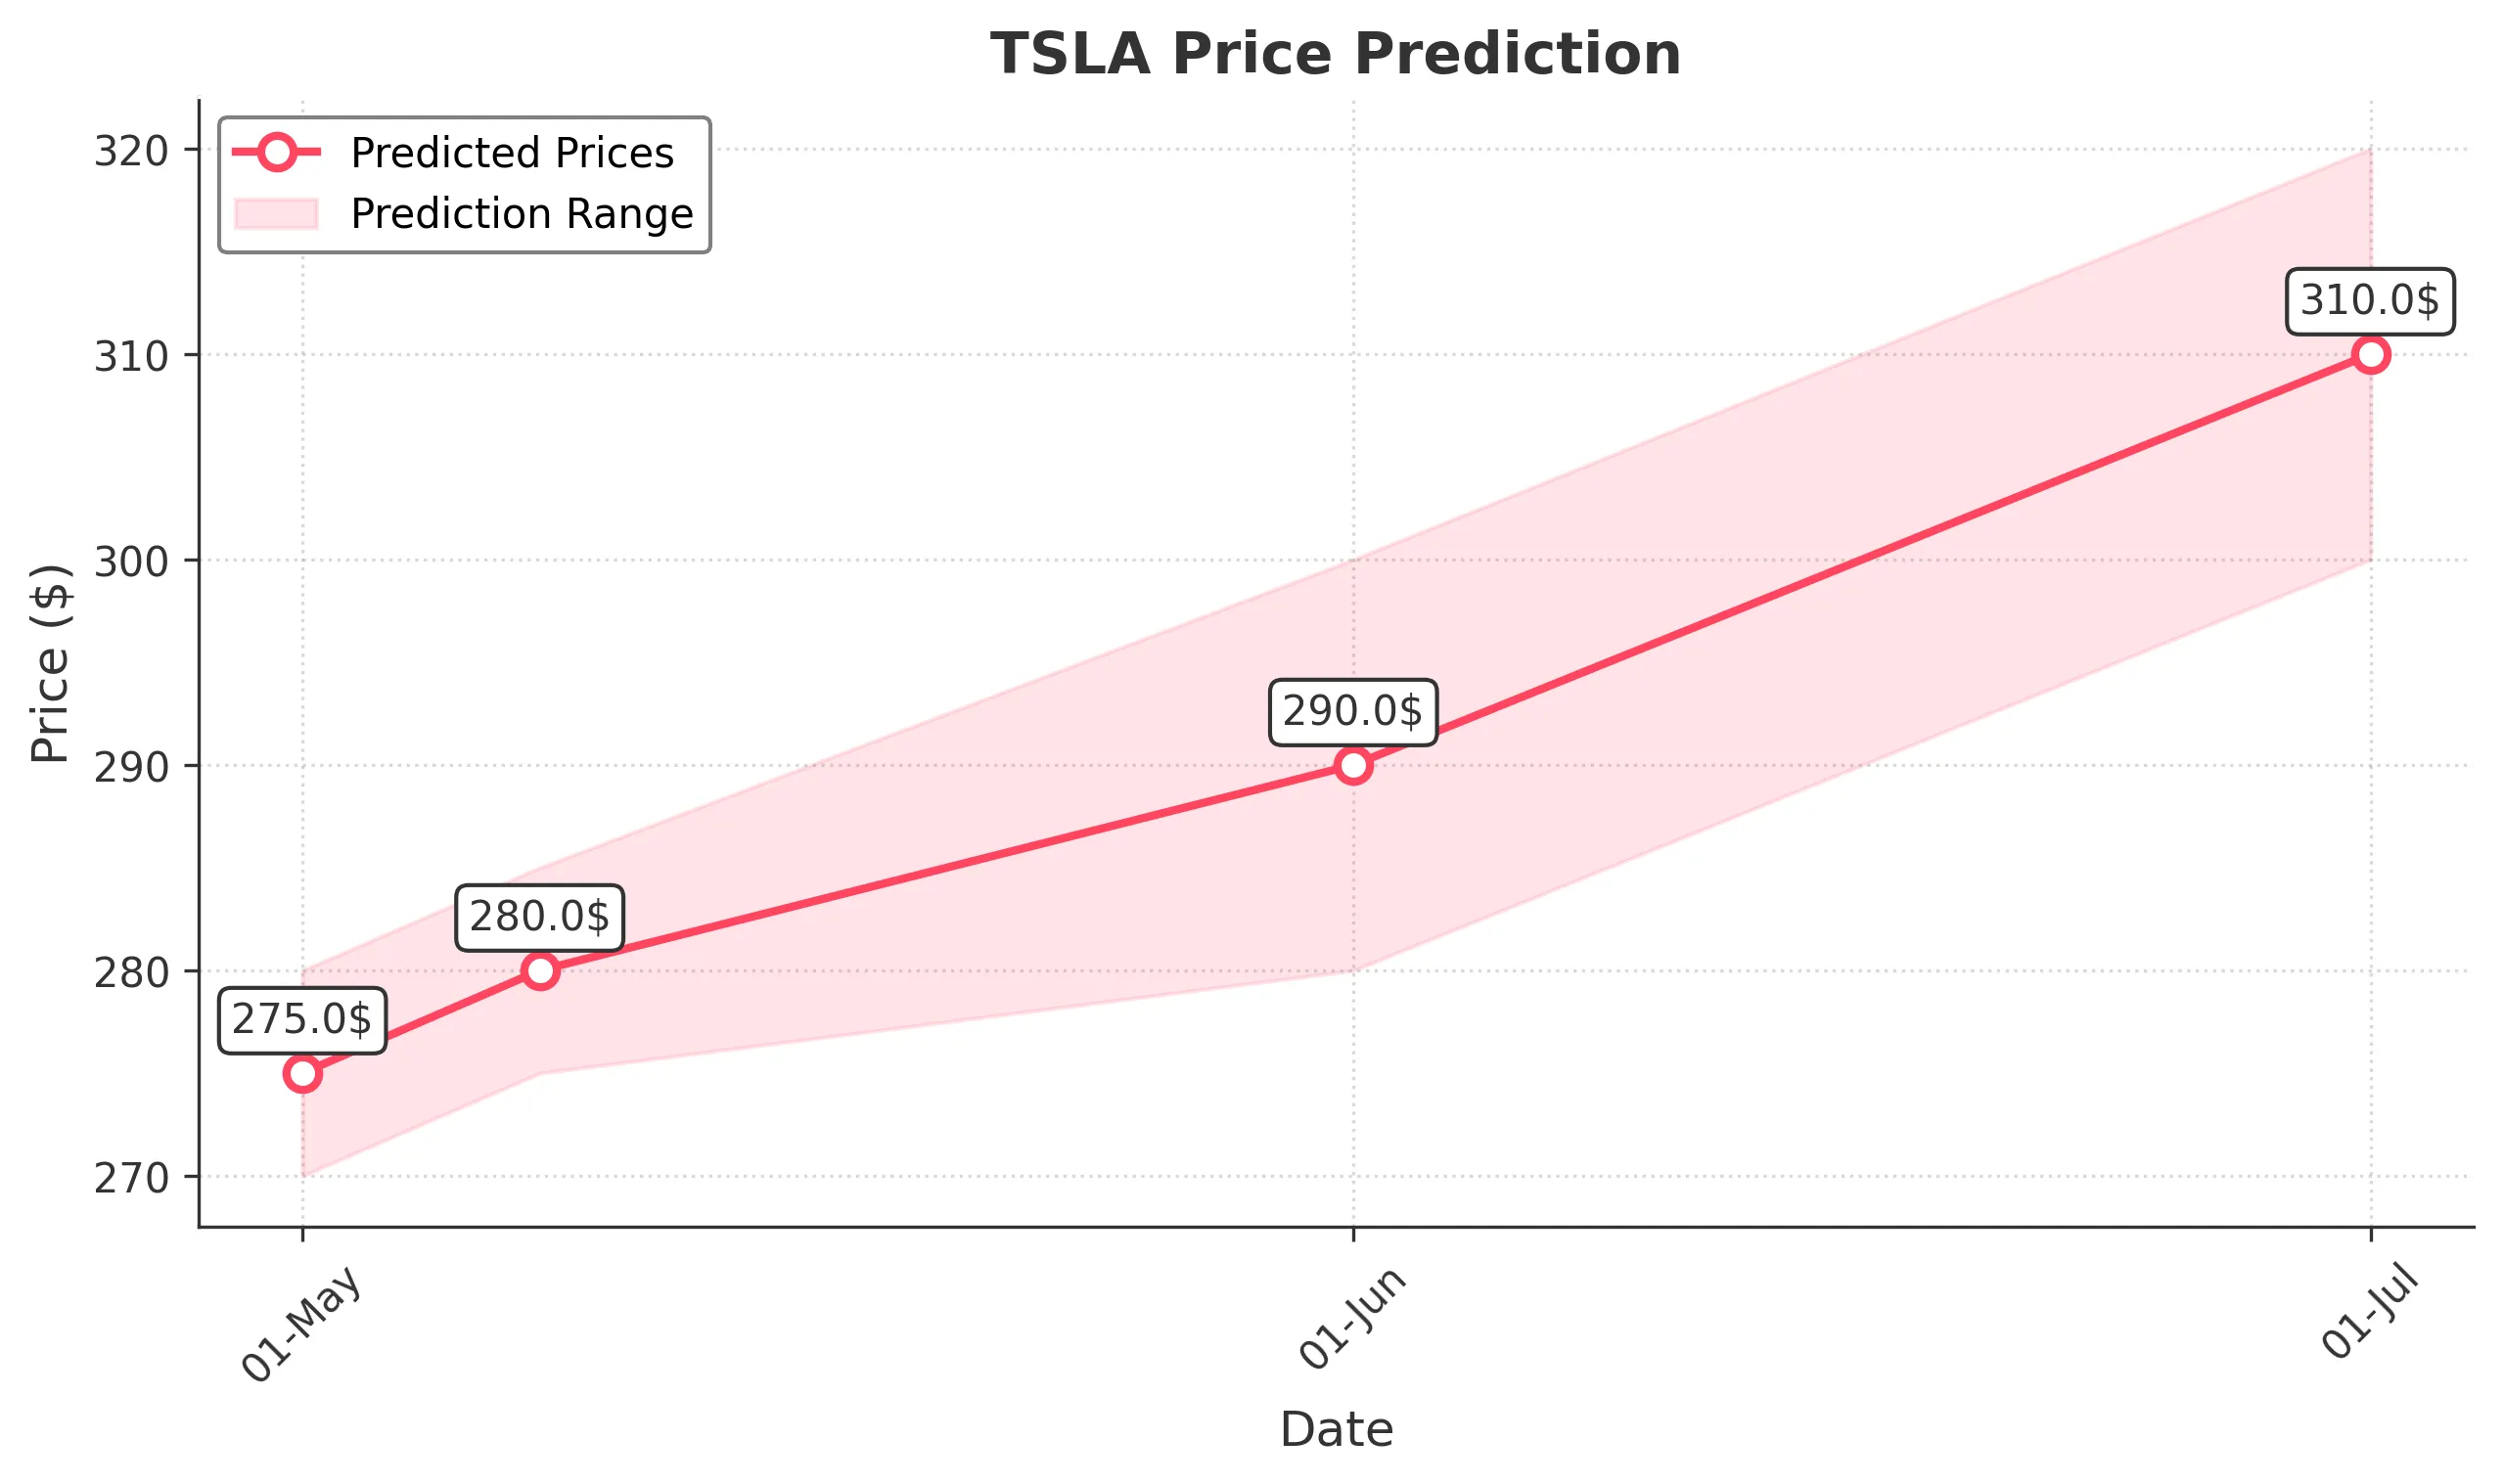
Target: May 1, 2025$275
$273
$280
$270
Description
The stock shows a slight bearish trend with recent lower highs and lower lows. RSI indicates oversold conditions, suggesting a potential bounce. However, MACD is bearish, and volume remains high, indicating selling pressure.
Analysis
Over the past 3 months, TSLA has experienced significant volatility, with a bearish trend evident since late February. Key support at $250 has been tested multiple times. Technical indicators show bearish momentum, but oversold conditions may lead to short-term rebounds.
Confidence Level
Potential Risks
Market volatility and external news could impact the prediction. A sudden positive catalyst could reverse the trend.
1 Week Prediction
Target: May 8, 2025$280
$278
$285
$275
Description
The stock may see a slight recovery as it approaches key Fibonacci retracement levels. However, bearish sentiment persists, and MACD remains negative. Watch for volume spikes that could indicate a reversal.
Analysis
TSLA's performance has been characterized by a bearish trend, with significant resistance around $290. The stock has tested support levels, and while there are signs of potential recovery, the overall sentiment remains cautious.
Confidence Level
Potential Risks
Continued bearish sentiment and macroeconomic factors could hinder recovery. A lack of buying interest may lead to further declines.
1 Month Prediction
Target: June 1, 2025$290
$285
$300
$280
Description
A potential recovery is anticipated as the stock approaches oversold conditions. If it can break above resistance at $290, further gains may follow. However, bearish MACD signals remain a concern.
Analysis
The past three months have shown a bearish trend with significant price fluctuations. Key support levels are being tested, and while there are signs of potential recovery, the overall market sentiment remains cautious.
Confidence Level
Potential Risks
Market sentiment and external factors could lead to unexpected volatility. A failure to break resistance may result in further declines.
3 Months Prediction
Target: July 1, 2025$310
$305
$320
$300
Description
If the stock can maintain upward momentum and break key resistance levels, a gradual recovery is possible. However, macroeconomic factors and market sentiment will play a crucial role in this timeframe.
Analysis
TSLA has faced significant challenges over the past three months, with a clear bearish trend. While there are potential signs of recovery, the stock remains vulnerable to external pressures and market sentiment.
Confidence Level
Potential Risks
Unforeseen market events or negative news could derail recovery efforts. The overall bearish trend may still weigh heavily on the stock.