TSLA Trading Predictions
1 Day Prediction
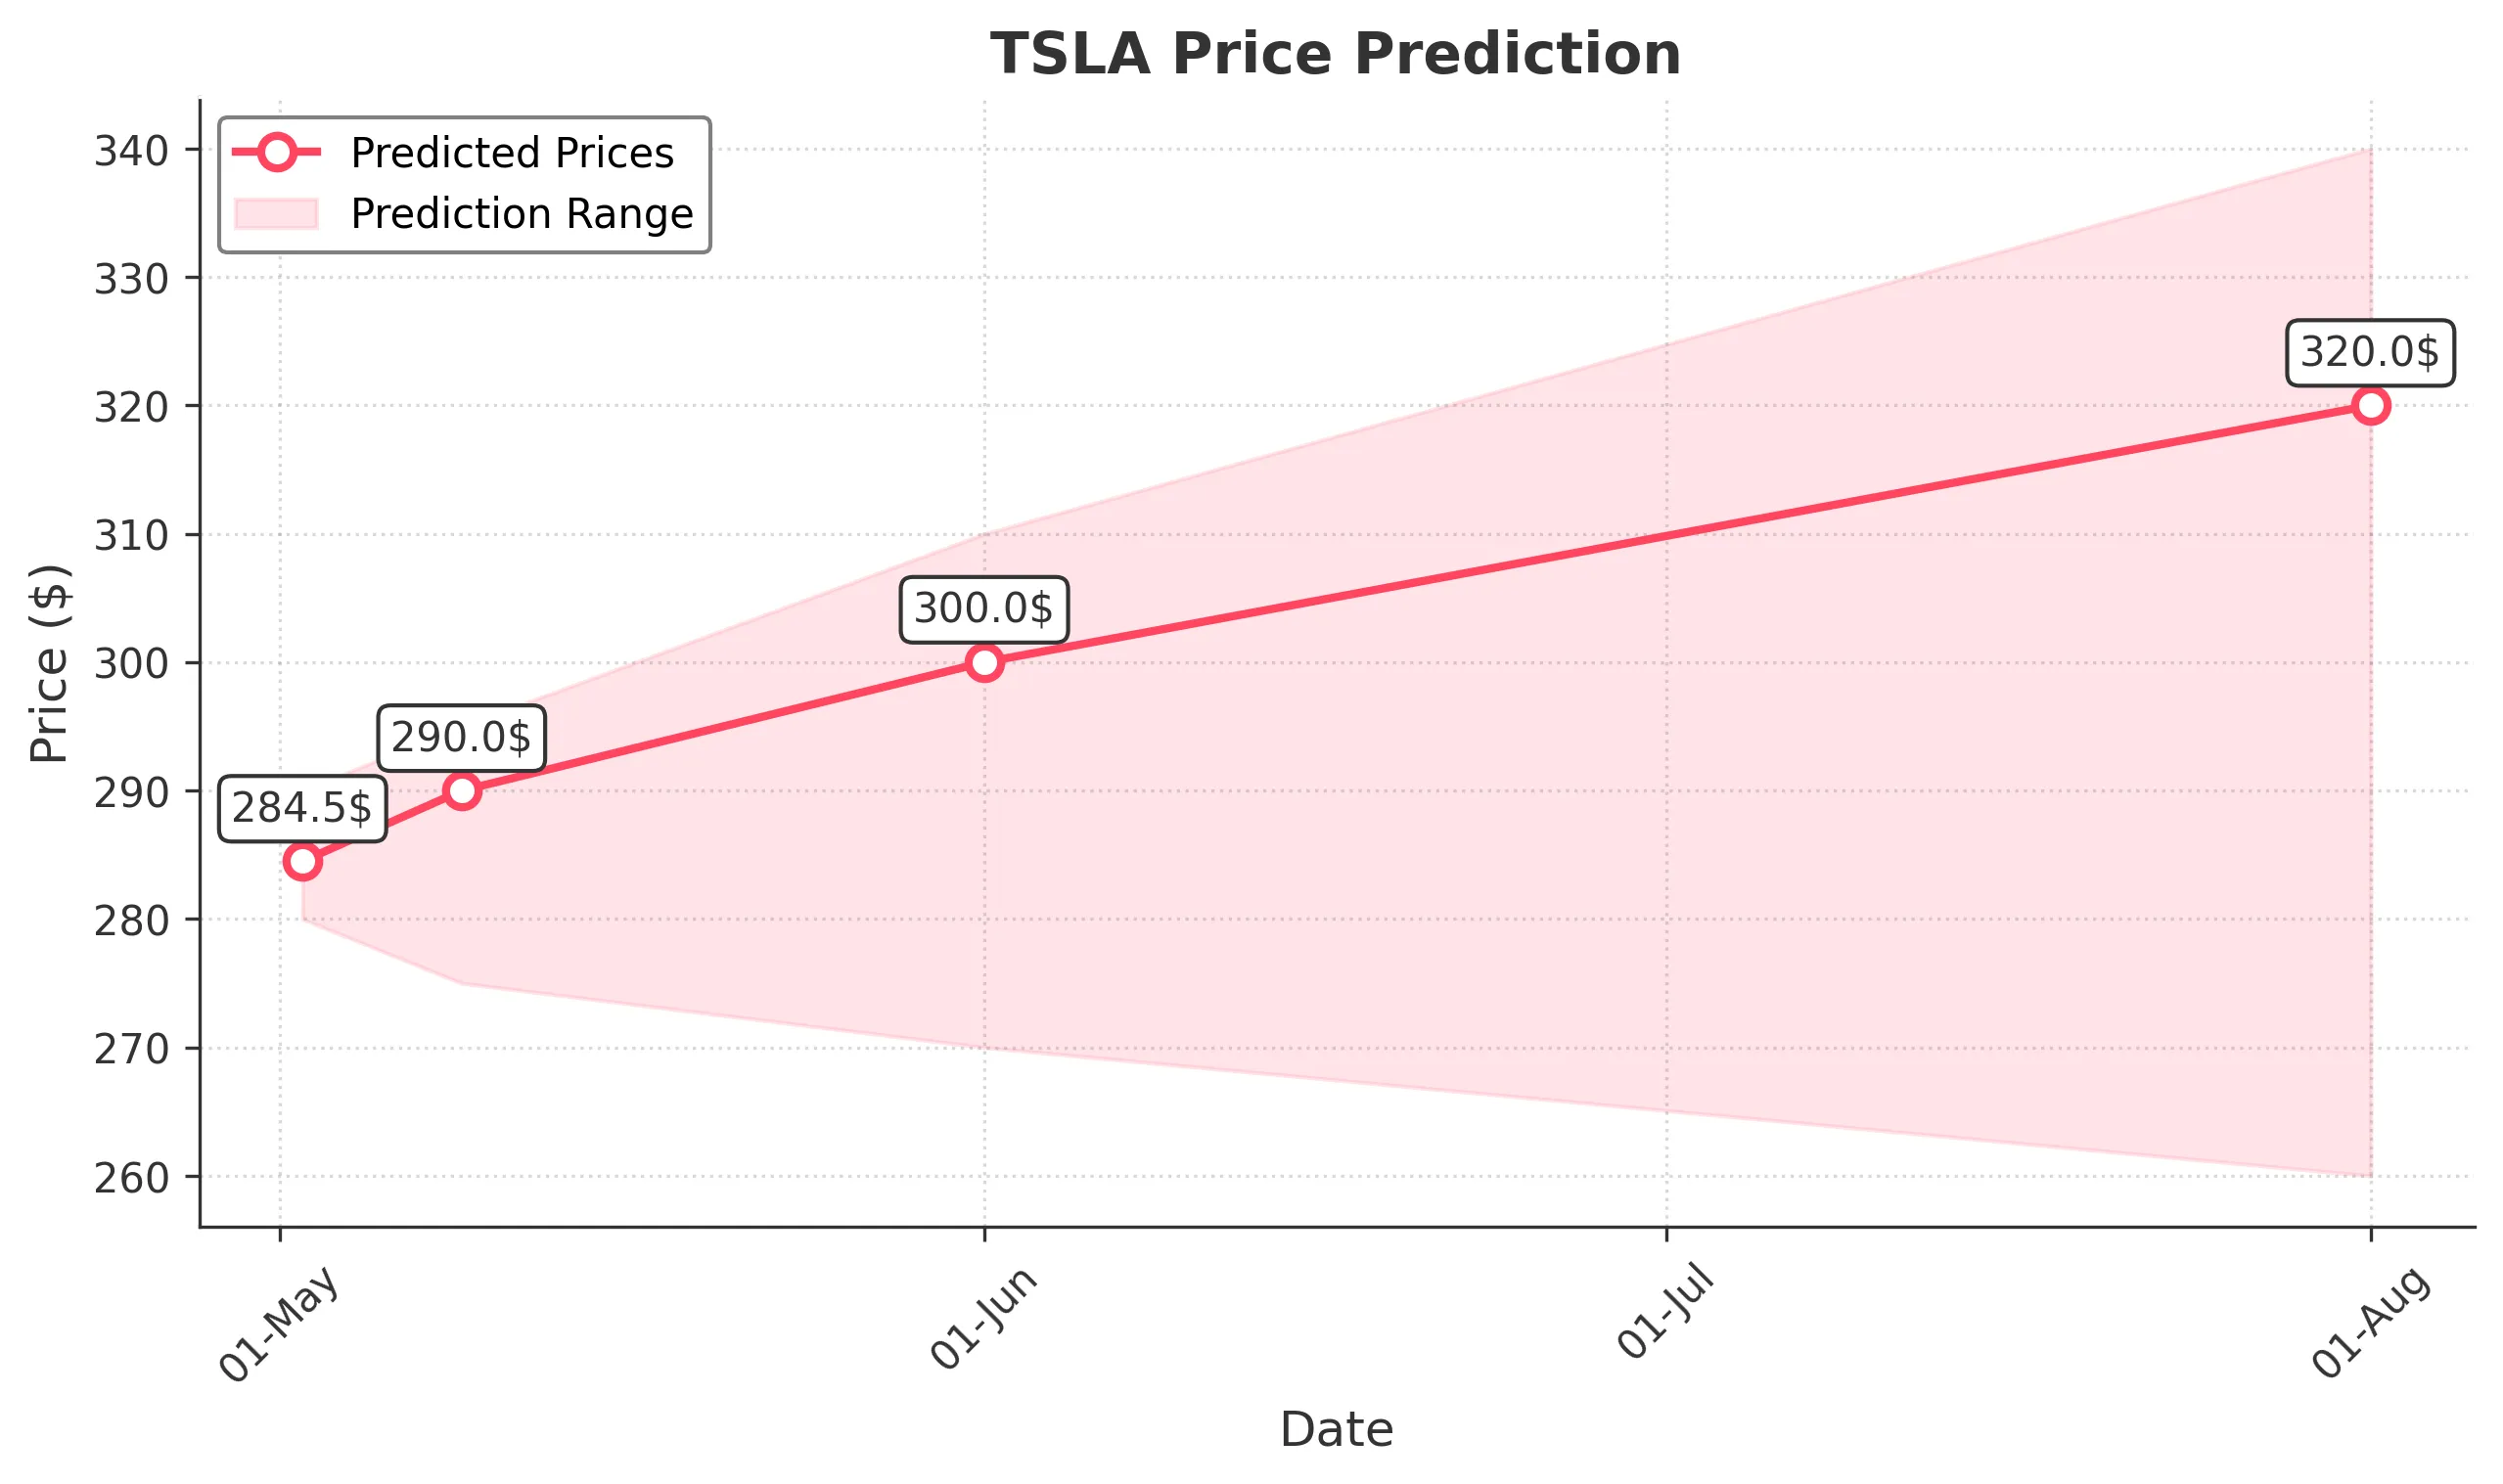
Target: May 2, 2025$284.5
$285
$290
$280
Description
The stock shows a slight bullish trend with a potential bounce from recent support levels. RSI indicates oversold conditions, suggesting a possible short-term recovery. However, volatility remains high, and market sentiment is mixed.
Analysis
Over the past 3 months, TSLA has experienced significant volatility, with a bearish trend dominating recently. Key support at $280 has been tested multiple times. Technical indicators like MACD show bearish momentum, while RSI suggests potential for a short-term rebound.
Confidence Level
Potential Risks
Market volatility and external news could impact the prediction. A sudden downturn is possible if bearish sentiment prevails.
1 Week Prediction
Target: May 9, 2025$290
$285.5
$295
$275
Description
A potential recovery is anticipated as the stock approaches key Fibonacci retracement levels. The recent bullish candlestick patterns indicate a possible reversal, but overall market sentiment remains cautious.
Analysis
The stock has shown a bearish trend with significant volume spikes during sell-offs. Support at $280 is critical, while resistance at $295 may limit upward movement. Technical indicators suggest a potential reversal, but caution is warranted due to overall market conditions.
Confidence Level
Potential Risks
Unforeseen macroeconomic events or earnings reports could lead to volatility. The bearish trend may still dominate if selling pressure continues.
1 Month Prediction
Target: June 1, 2025$300
$295
$310
$270
Description
If the bullish momentum continues, TSLA could reach $300, supported by recent positive sentiment and potential recovery patterns. However, resistance levels may hinder progress.
Analysis
The stock has been in a bearish phase, but recent patterns suggest a potential recovery. Key resistance at $310 and support at $270 are critical. Technical indicators show mixed signals, indicating uncertainty in the market.
Confidence Level
Potential Risks
Market sentiment is volatile, and external factors could reverse the trend. Earnings reports or economic data releases may significantly impact stock performance.
3 Months Prediction
Target: August 1, 2025$320
$310
$340
$260
Description
If the market stabilizes and positive sentiment prevails, TSLA could reach $320. However, the potential for further declines exists if bearish trends continue.
Analysis
The stock has faced significant downward pressure, with key support levels being tested. The overall trend remains bearish, but a recovery could occur if market conditions improve. Technical indicators suggest caution, with potential for both upward and downward movements.
Confidence Level
Potential Risks
Long-term predictions are uncertain due to market volatility and potential economic downturns. External factors could significantly impact stock performance.