TSLA Trading Predictions
1 Day Prediction
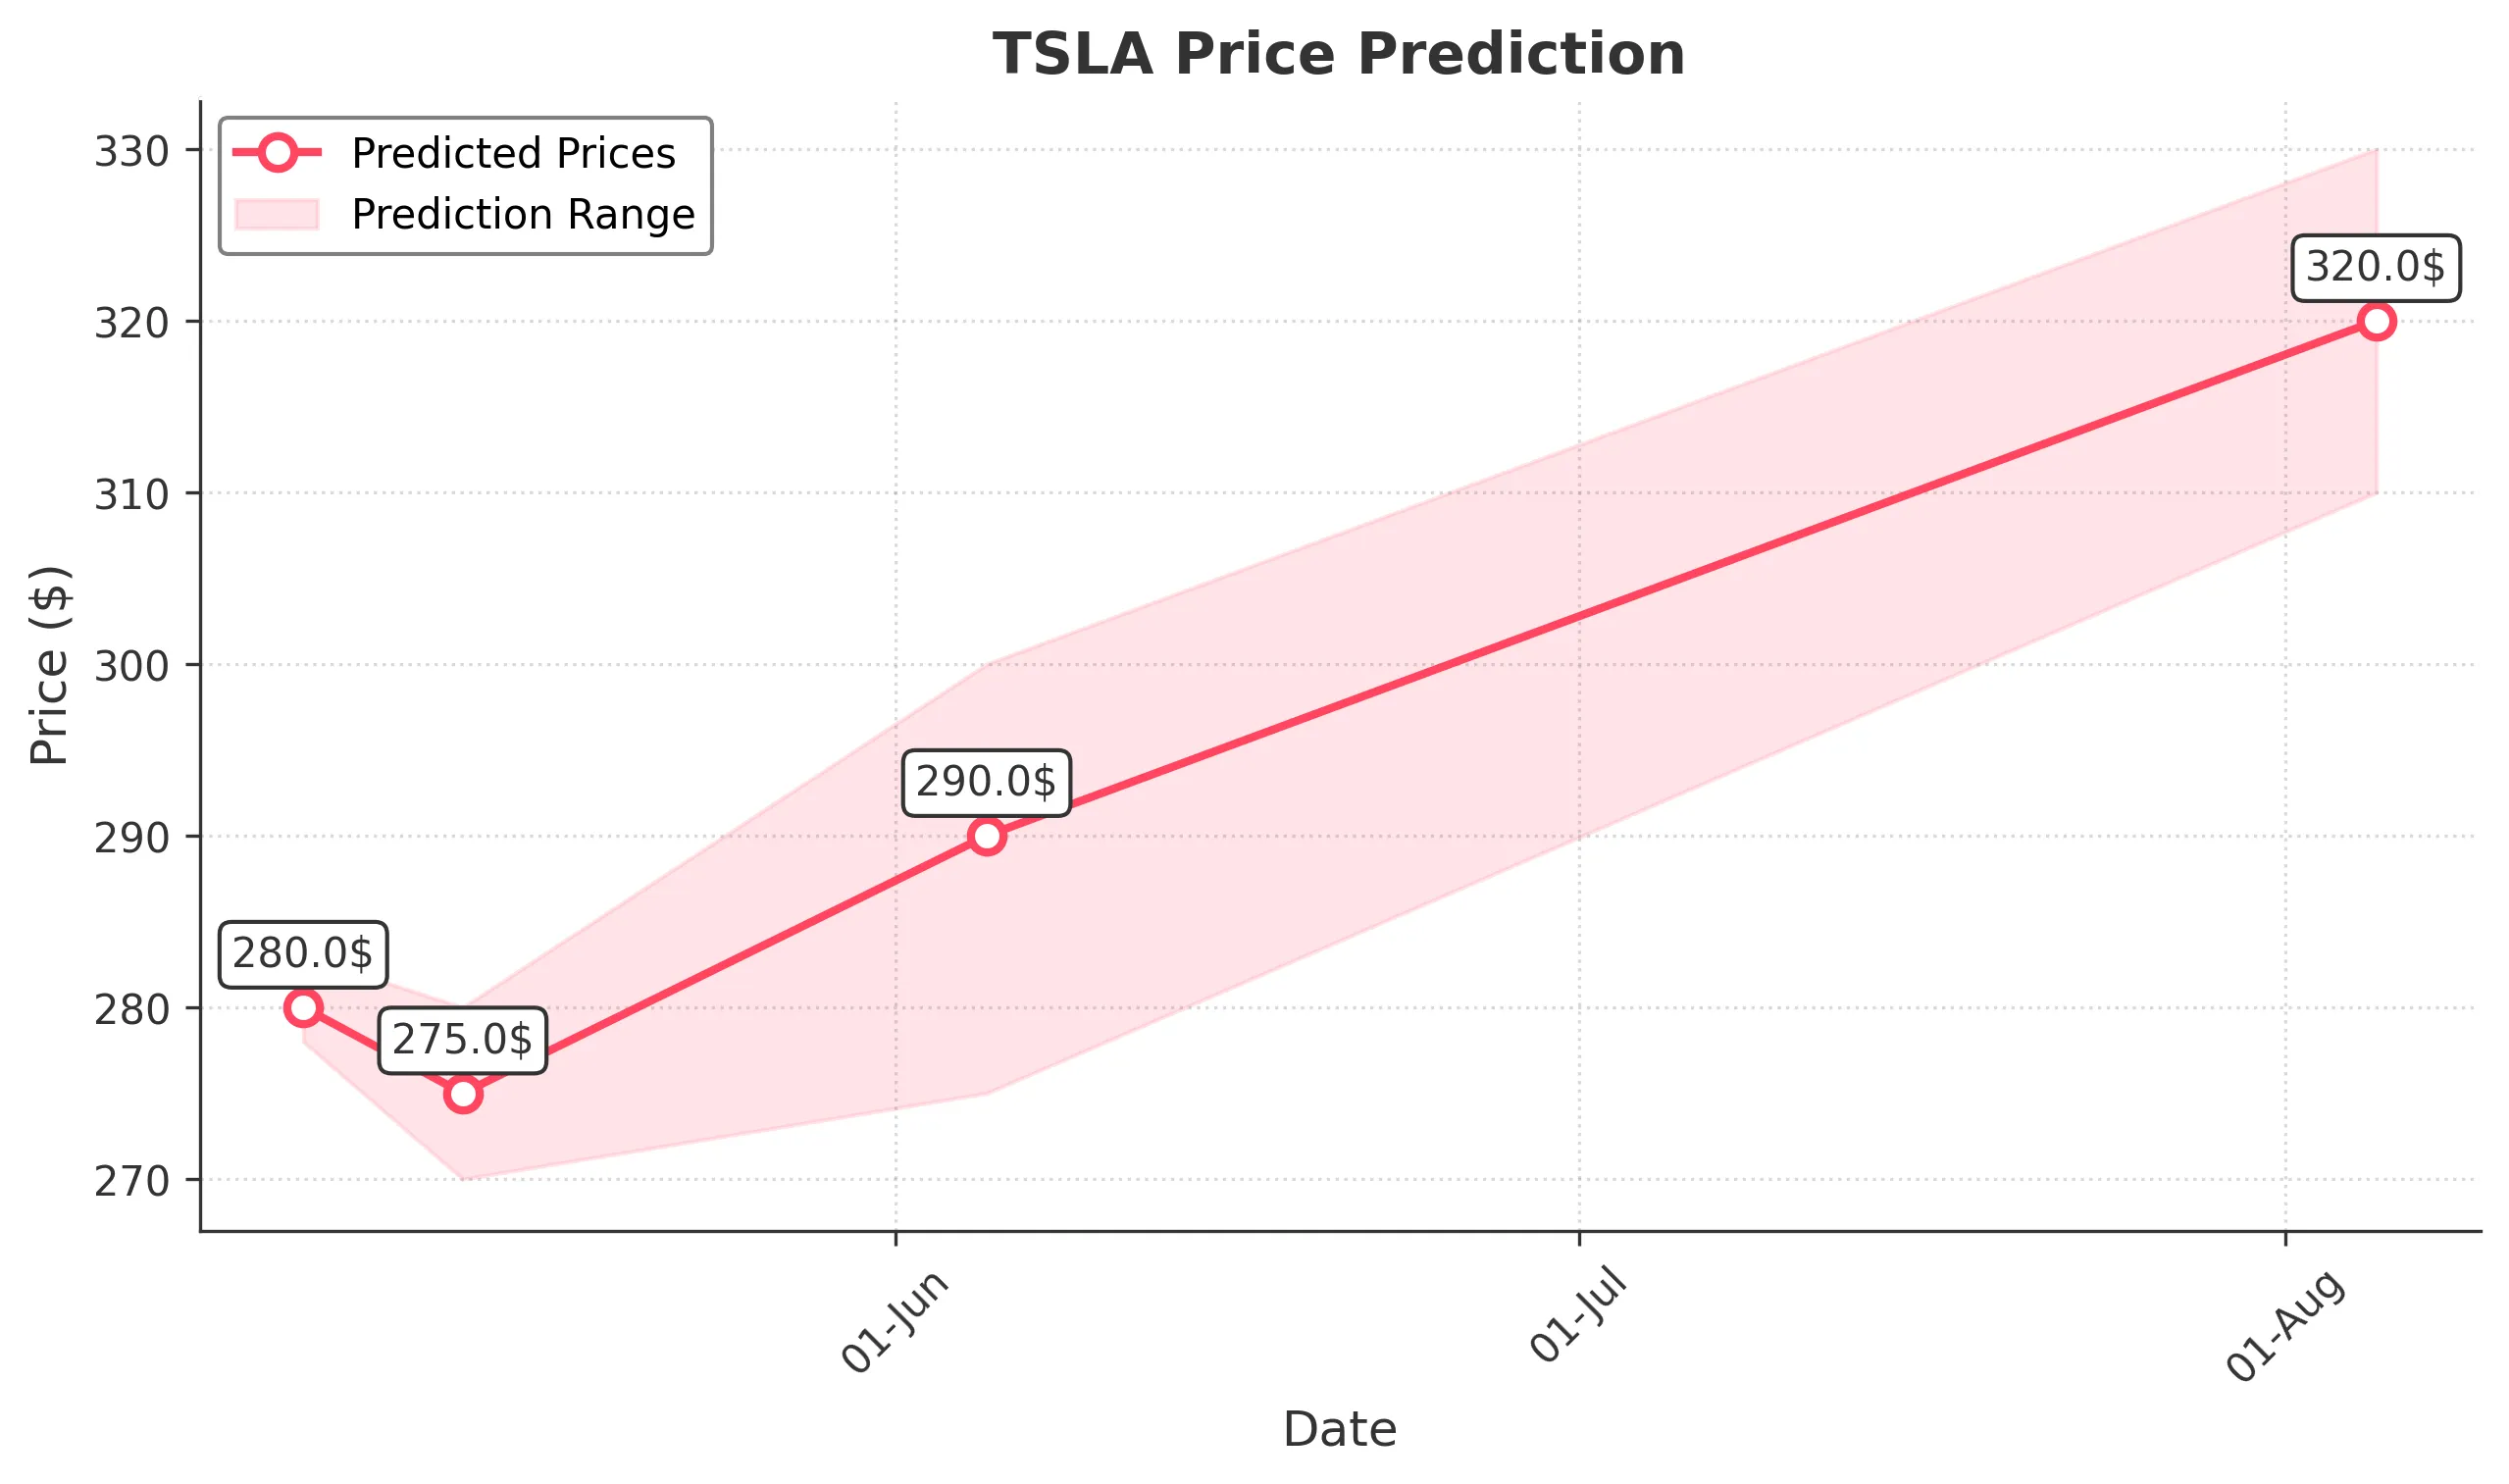
Target: May 6, 2025$280
$279
$283
$278
Description
The stock shows a slight bearish trend with recent lower highs and lower lows. RSI indicates oversold conditions, suggesting a potential bounce. However, MACD is bearish, and volume is declining, indicating caution.
Analysis
Over the past 3 months, TSLA has experienced significant volatility, with a bearish trend evident since mid-February. Key support at $250 has been tested multiple times. Technical indicators show mixed signals, with RSI nearing oversold levels but MACD remaining bearish. Volume spikes during sell-offs indicate strong selling pressure.
Confidence Level
Potential Risks
Market volatility and external news could impact the prediction. A sudden positive catalyst could lead to a price increase.
1 Week Prediction
Target: May 13, 2025$275
$273
$280
$270
Description
The bearish trend may continue, but a potential short-term recovery is possible as the stock approaches key support levels. Watch for volume spikes that could indicate a reversal.
Analysis
TSLA has been in a downtrend, with significant resistance around $290. The stock has tested support levels around $250-$260. Technical indicators suggest a potential bounce, but overall sentiment remains cautious. Volume analysis shows increased selling pressure, indicating a bearish outlook.
Confidence Level
Potential Risks
Uncertainty in market sentiment and potential macroeconomic events could lead to unexpected price movements.
1 Month Prediction
Target: June 5, 2025$290
$285
$300
$275
Description
A potential recovery could occur as the stock approaches key Fibonacci retracement levels. However, bearish sentiment persists, and any positive news could drive prices higher.
Analysis
The stock has shown a bearish trend with significant fluctuations. Key support at $250 has held, but resistance at $290 remains strong. Technical indicators are mixed, with potential for a bounce if volume increases. Market sentiment is cautious, influenced by macroeconomic factors.
Confidence Level
Potential Risks
Market conditions and external factors could lead to further declines or volatility, impacting the prediction.
3 Months Prediction
Target: August 5, 2025$320
$315
$330
$310
Description
If the stock can break through resistance levels, a bullish trend may develop. However, macroeconomic factors and market sentiment will play a crucial role in determining the direction.
Analysis
The overall trend has been bearish, but a potential reversal could occur if key resistance levels are broken. Technical indicators suggest a possible recovery, but market sentiment remains fragile. Volume patterns indicate strong selling pressure, which could hinder upward movement.
Confidence Level
Potential Risks
Long-term predictions are highly uncertain due to potential market volatility and external influences.