TSLA Trading Predictions
1 Day Prediction
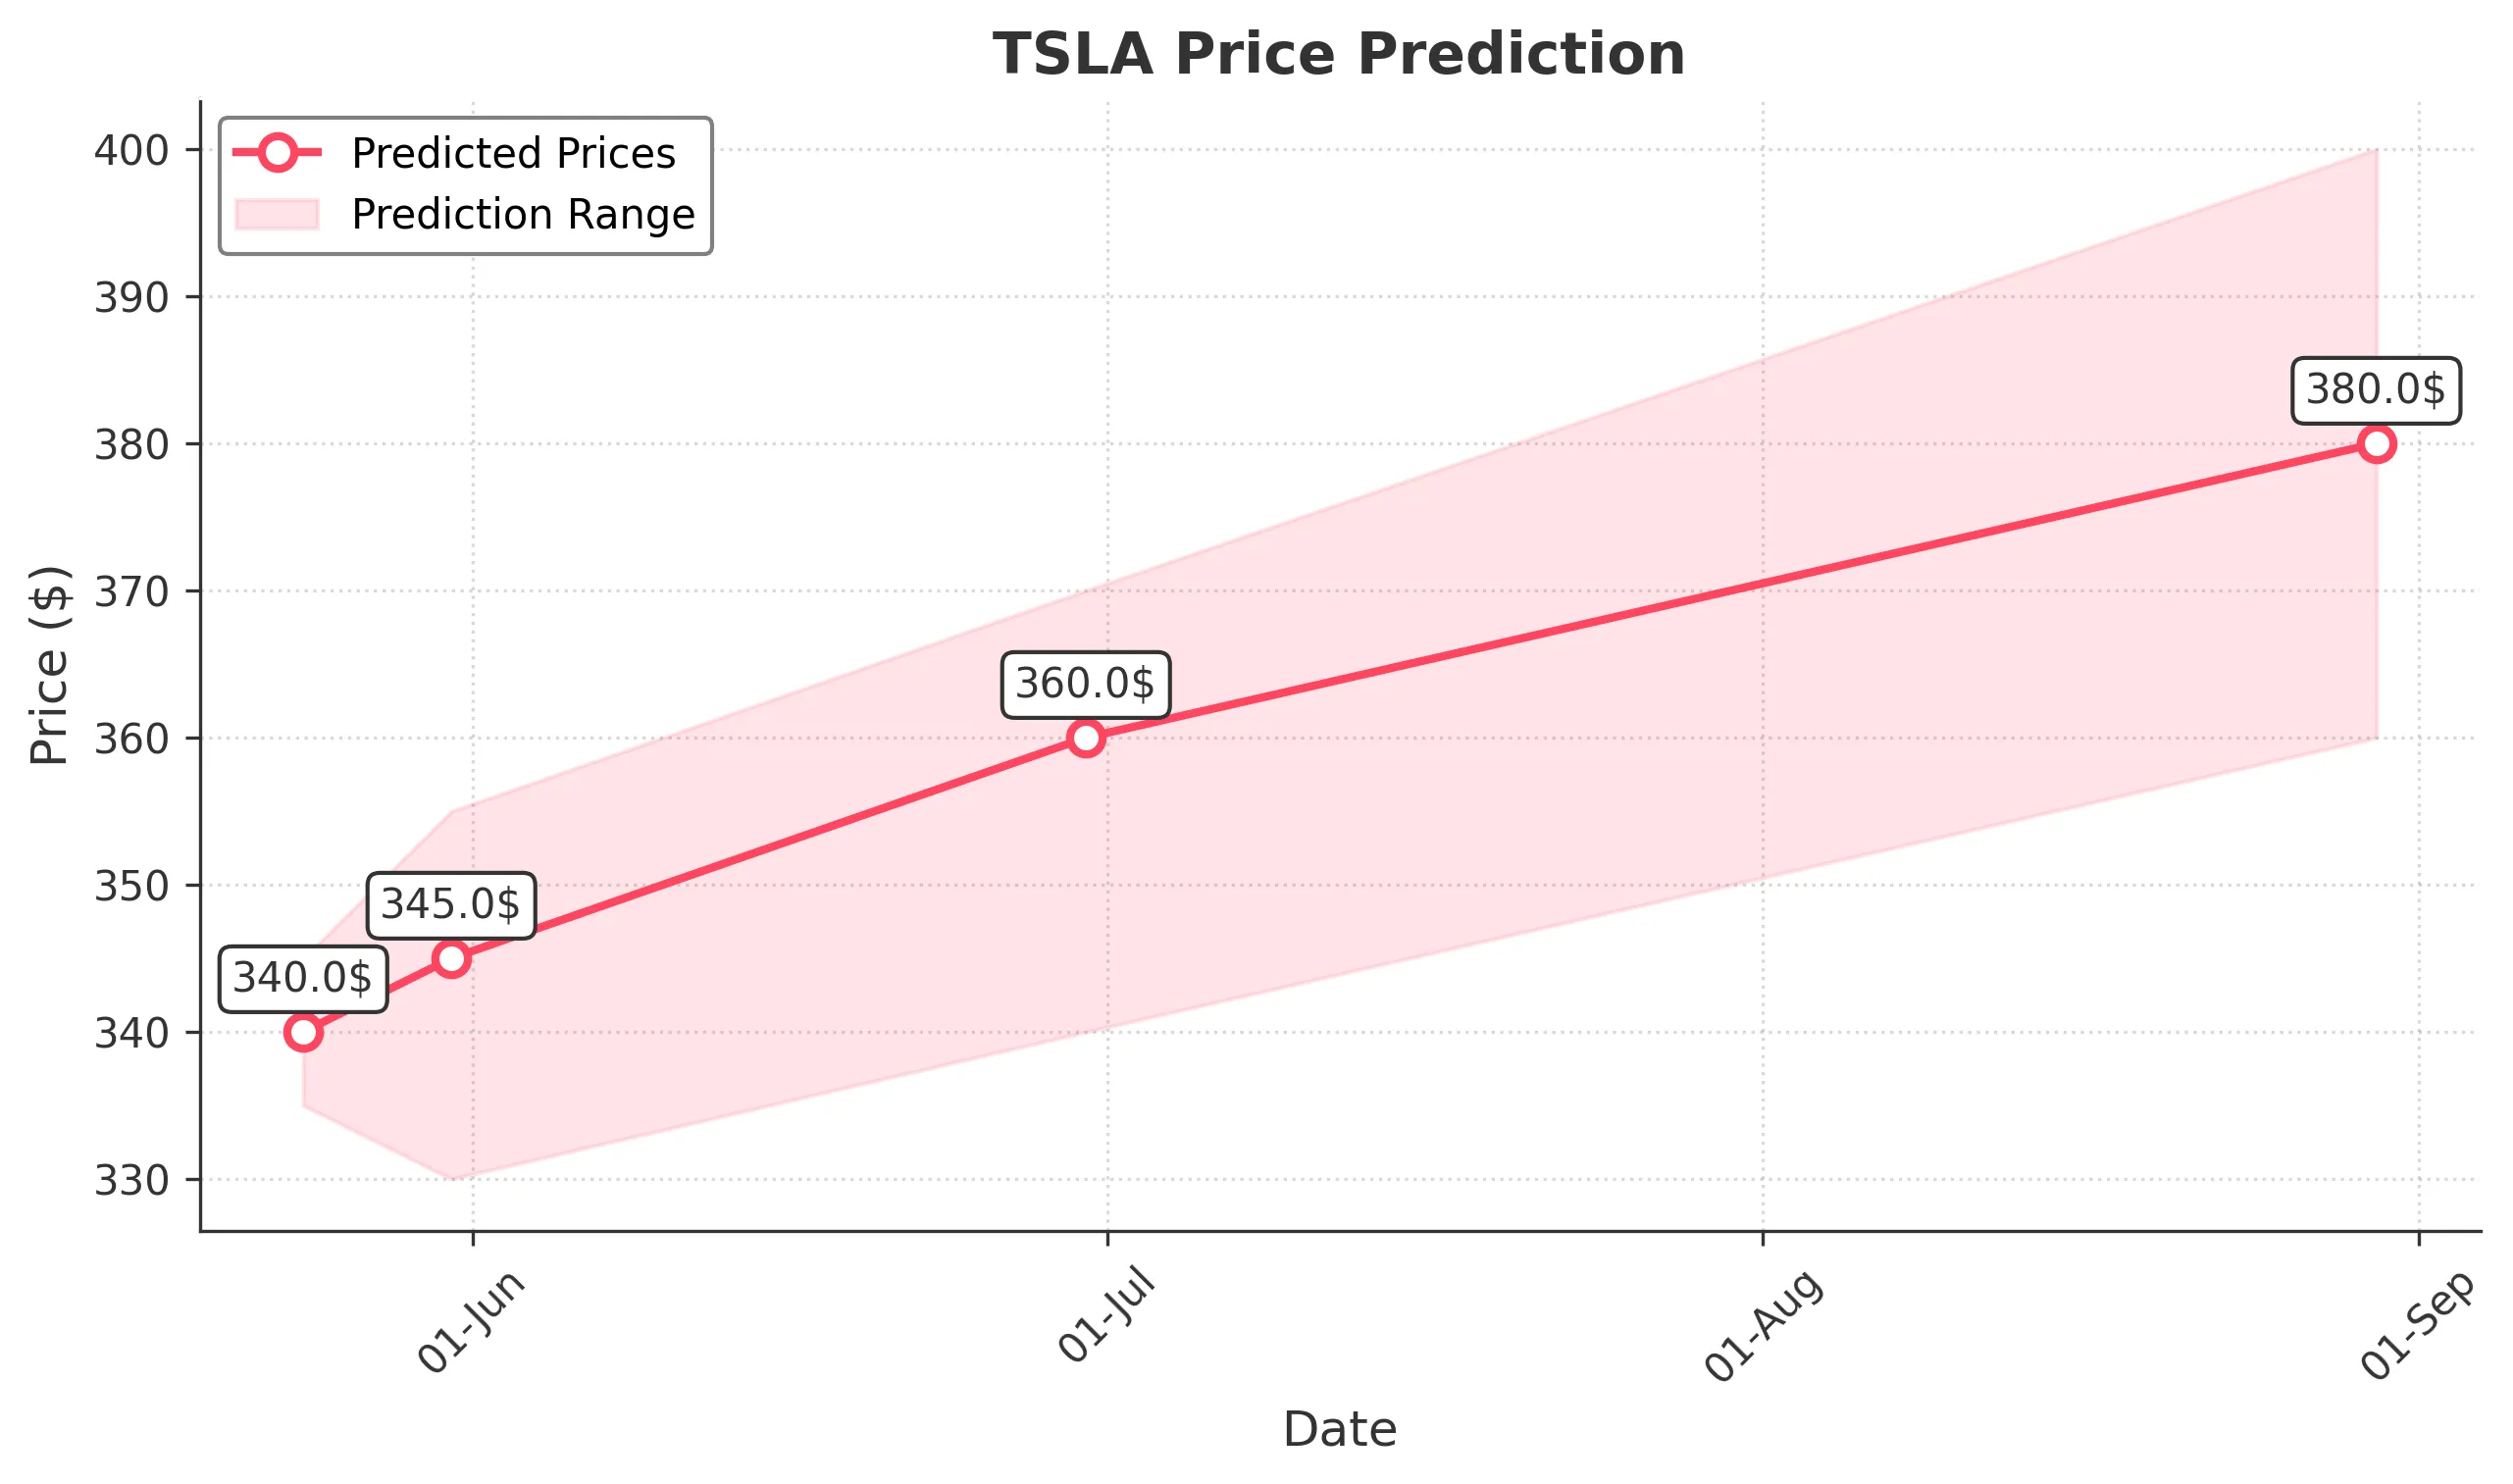
Target: May 24, 2025$340
$338
$345
$335
Description
The stock shows a bullish trend with a recent upward movement. The RSI is approaching overbought levels, indicating potential for a pullback. However, strong volume suggests continued interest. Watch for resistance at $345.
Analysis
Over the past 3 months, TSLA has shown volatility with a bearish phase followed by a recovery. Key support at $250 and resistance at $350. Recent bullish candlestick patterns and increasing volume indicate a possible upward trend, but macroeconomic factors could introduce volatility.
Confidence Level
Potential Risks
Potential for a pullback due to overbought RSI. Market sentiment could shift quickly.
1 Week Prediction
Target: May 31, 2025$345
$340
$355
$330
Description
The stock is expected to continue its upward trajectory, supported by recent bullish momentum. However, the MACD shows signs of divergence, which could indicate a potential reversal. Watch for resistance at $355.
Analysis
TSLA has experienced a recovery from recent lows, with key resistance at $355. The RSI is nearing overbought territory, suggesting caution. Volume spikes indicate strong interest, but macroeconomic uncertainties could impact performance.
Confidence Level
Potential Risks
Divergence in MACD raises concerns about sustainability of the upward trend. Market sentiment may shift based on external news.
1 Month Prediction
Target: June 30, 2025$360
$355
$370
$340
Description
Expect continued bullish momentum as the stock breaks through resistance levels. The Fibonacci retracement suggests a target of $360. However, watch for potential pullbacks as the RSI approaches overbought levels.
Analysis
The past 3 months show a recovery from lows, with significant resistance at $370. The stock has been trading above key moving averages, indicating bullish sentiment. Volume patterns suggest strong buying interest, but macroeconomic events could introduce risks.
Confidence Level
Potential Risks
Market volatility and external economic factors could impact the stock's performance. Watch for signs of reversal.
3 Months Prediction
Target: August 30, 2025$380
$370
$400
$360
Description
The stock is projected to reach $380 as it continues to capitalize on bullish momentum. However, the potential for market corrections exists, especially if macroeconomic conditions worsen. Watch for resistance at $400.
Analysis
TSLA's performance over the last 3 months has shown a recovery with key support at $340 and resistance at $400. The stock is trading above its moving averages, indicating bullish sentiment. However, external factors could introduce volatility, necessitating caution.
Confidence Level
Potential Risks
Economic indicators and market sentiment could lead to volatility. A correction could occur if the stock becomes overbought.