TSLA Trading Predictions
1 Day Prediction
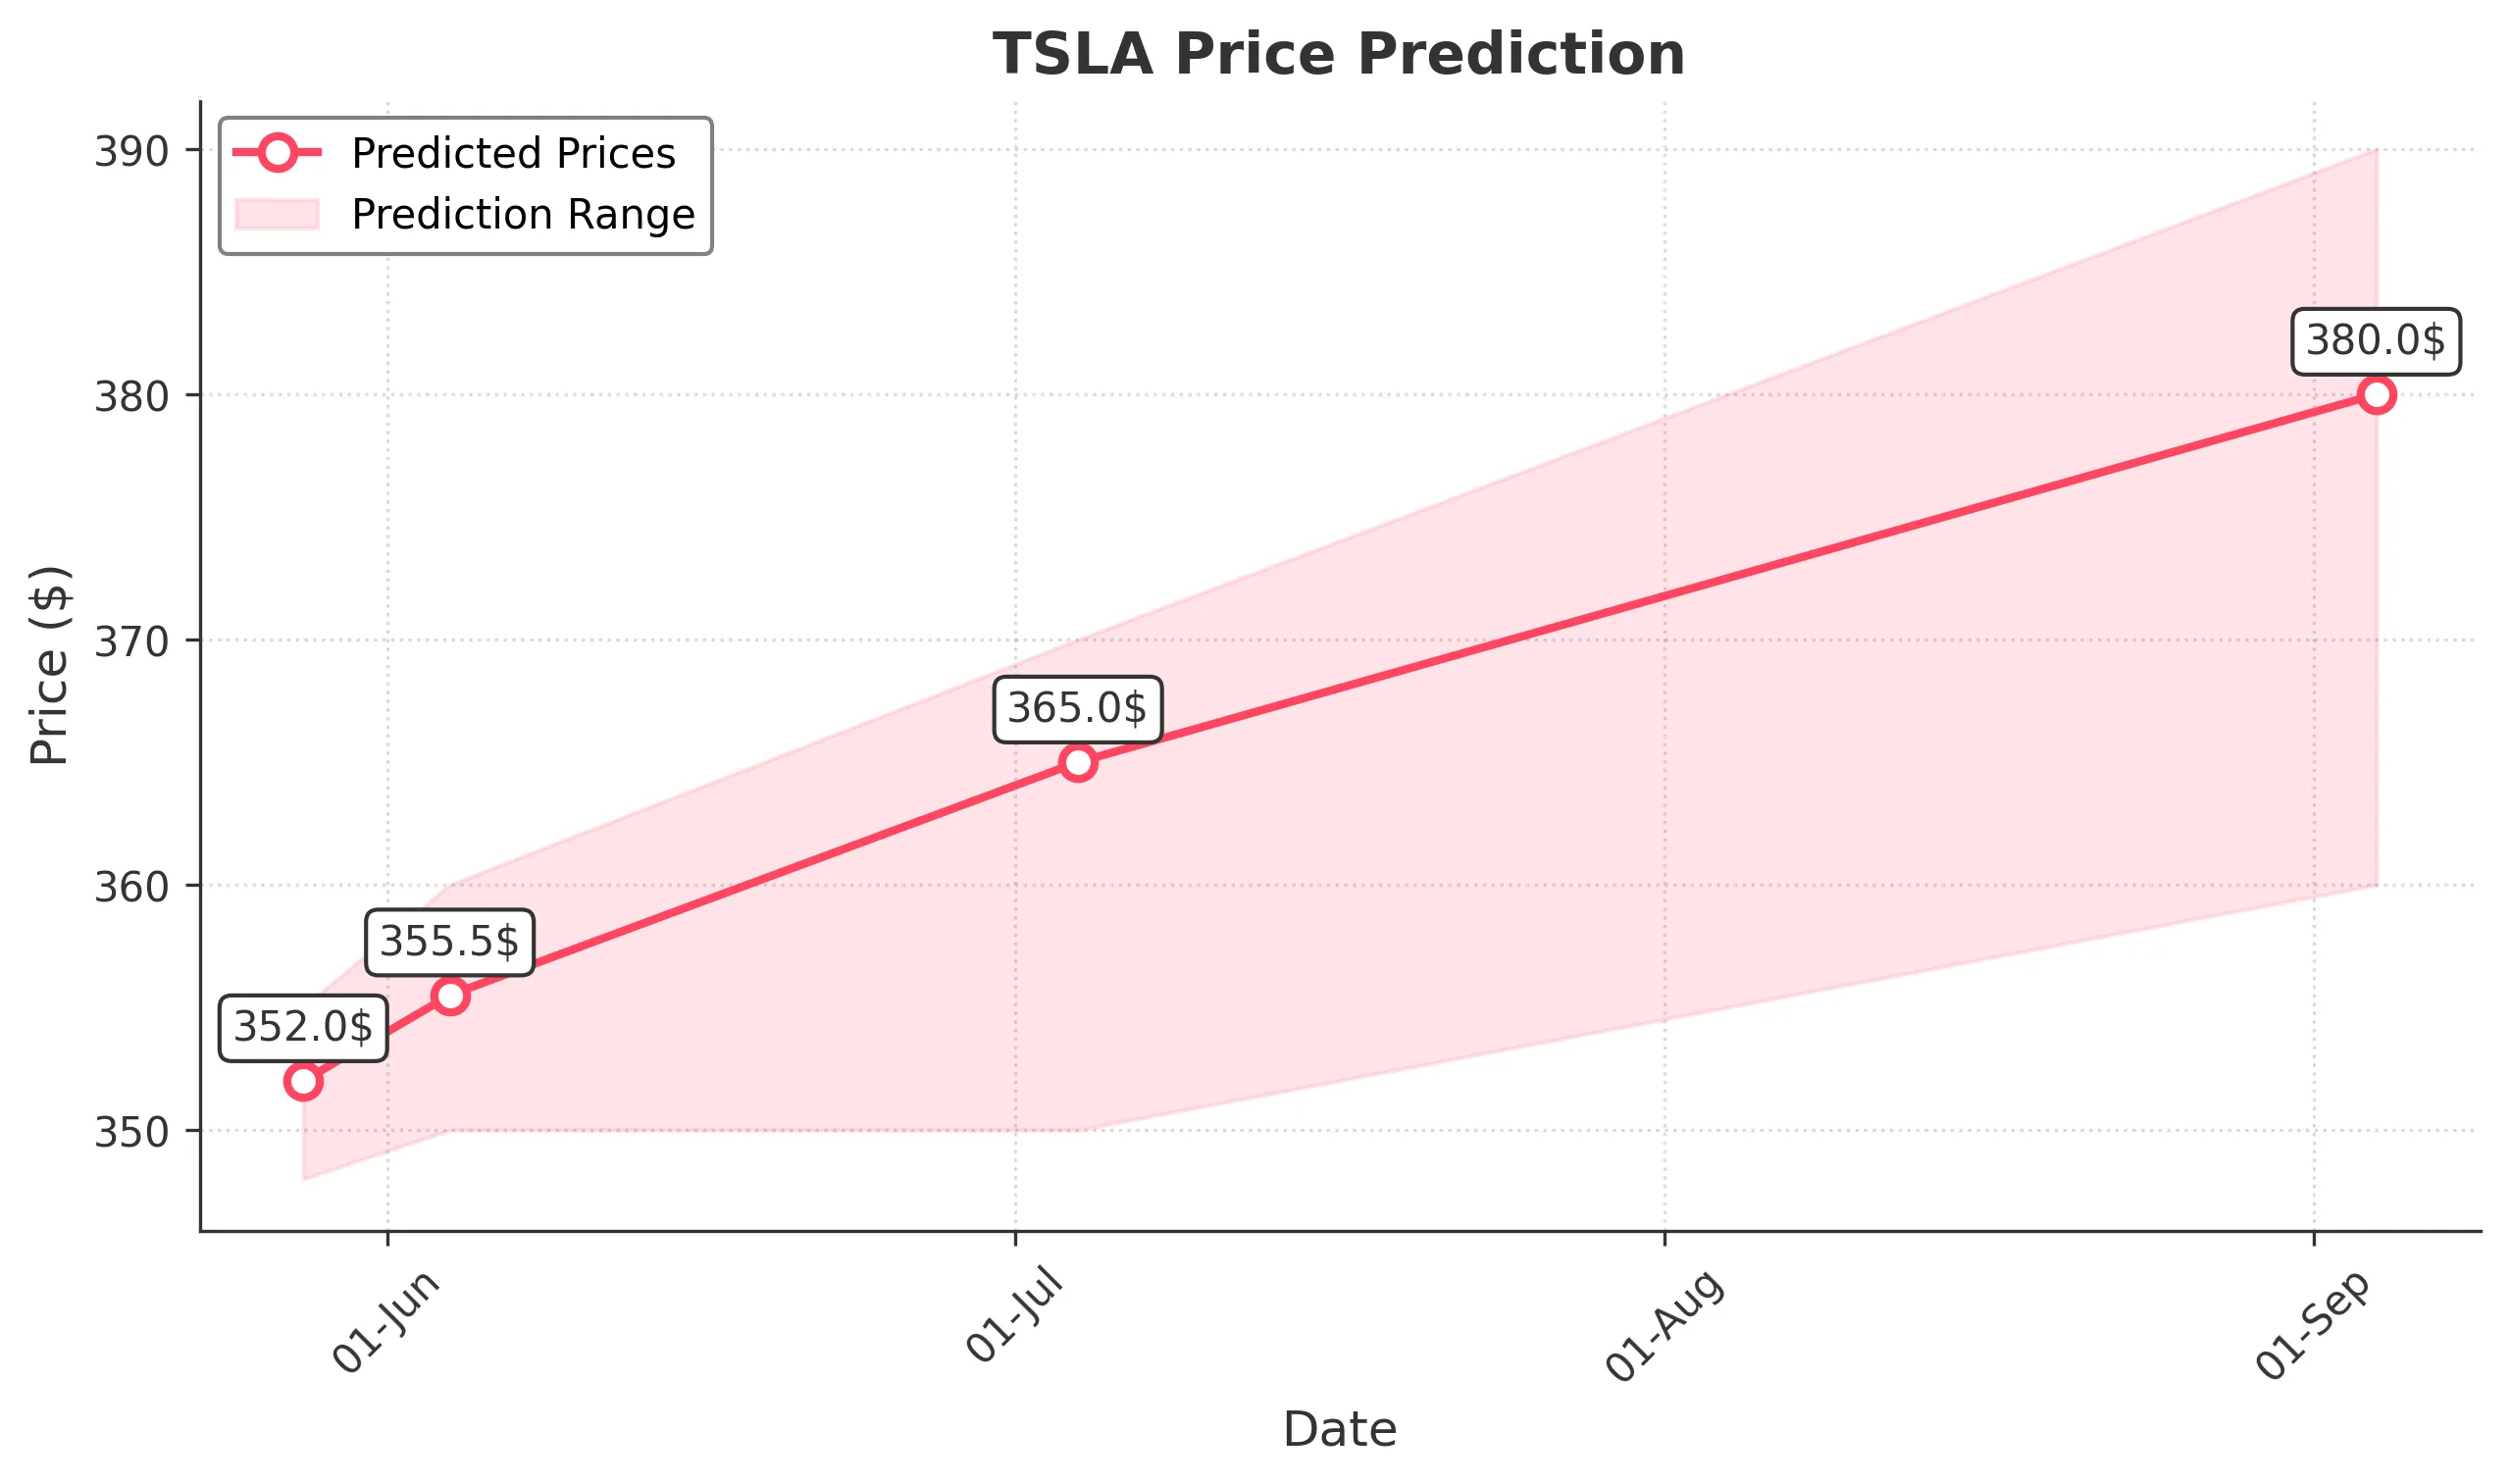
Target: May 28, 2025$352
$350.5
$355
$348
Description
The stock shows bullish momentum with a recent upward trend. The RSI is approaching overbought levels, indicating potential for a pullback. However, strong volume and positive market sentiment suggest a continued rise in the short term.
Analysis
Over the past 3 months, TSLA has shown a bullish trend with significant price recovery from lows. Key support at $280 and resistance around $350. Volume spikes indicate strong buying interest. However, the RSI nearing overbought levels suggests caution.
Confidence Level
Potential Risks
Potential for a pullback due to overbought RSI levels and market volatility.
1 Week Prediction
Target: June 4, 2025$355.5
$352
$360
$350
Description
The upward trend is expected to continue, supported by bullish candlestick patterns and strong volume. However, the MACD shows signs of potential divergence, which could indicate a weakening momentum.
Analysis
TSLA has been on a bullish trajectory, with key resistance at $360. The MACD is bullish but shows signs of divergence. Volume remains strong, indicating continued interest, but caution is warranted as the stock approaches overbought territory.
Confidence Level
Potential Risks
Possible market corrections or profit-taking could impact the price.
1 Month Prediction
Target: July 4, 2025$365
$360
$370
$350
Description
The stock is expected to maintain its bullish trend, supported by strong fundamentals and positive market sentiment. However, the RSI indicates potential overbought conditions, suggesting a possible correction.
Analysis
In the last 3 months, TSLA has shown a strong recovery with significant price increases. Key support at $350 and resistance at $370. The stock's volatility is increasing, and while the trend is bullish, external factors could impact future performance.
Confidence Level
Potential Risks
Market volatility and external economic factors could lead to unexpected price movements.
3 Months Prediction
Target: September 4, 2025$380
$375
$390
$360
Description
Long-term bullish sentiment is expected to prevail, driven by strong fundamentals and market demand. However, potential economic headwinds could create volatility.
Analysis
TSLA has shown a strong upward trend over the past 3 months, with key support at $360 and resistance at $390. The stock's volatility is increasing, and while the long-term outlook remains positive, external economic factors could introduce risks.
Confidence Level
Potential Risks
Economic uncertainties and potential market corrections could affect the stock's performance.