TSLA Trading Predictions
1 Day Prediction
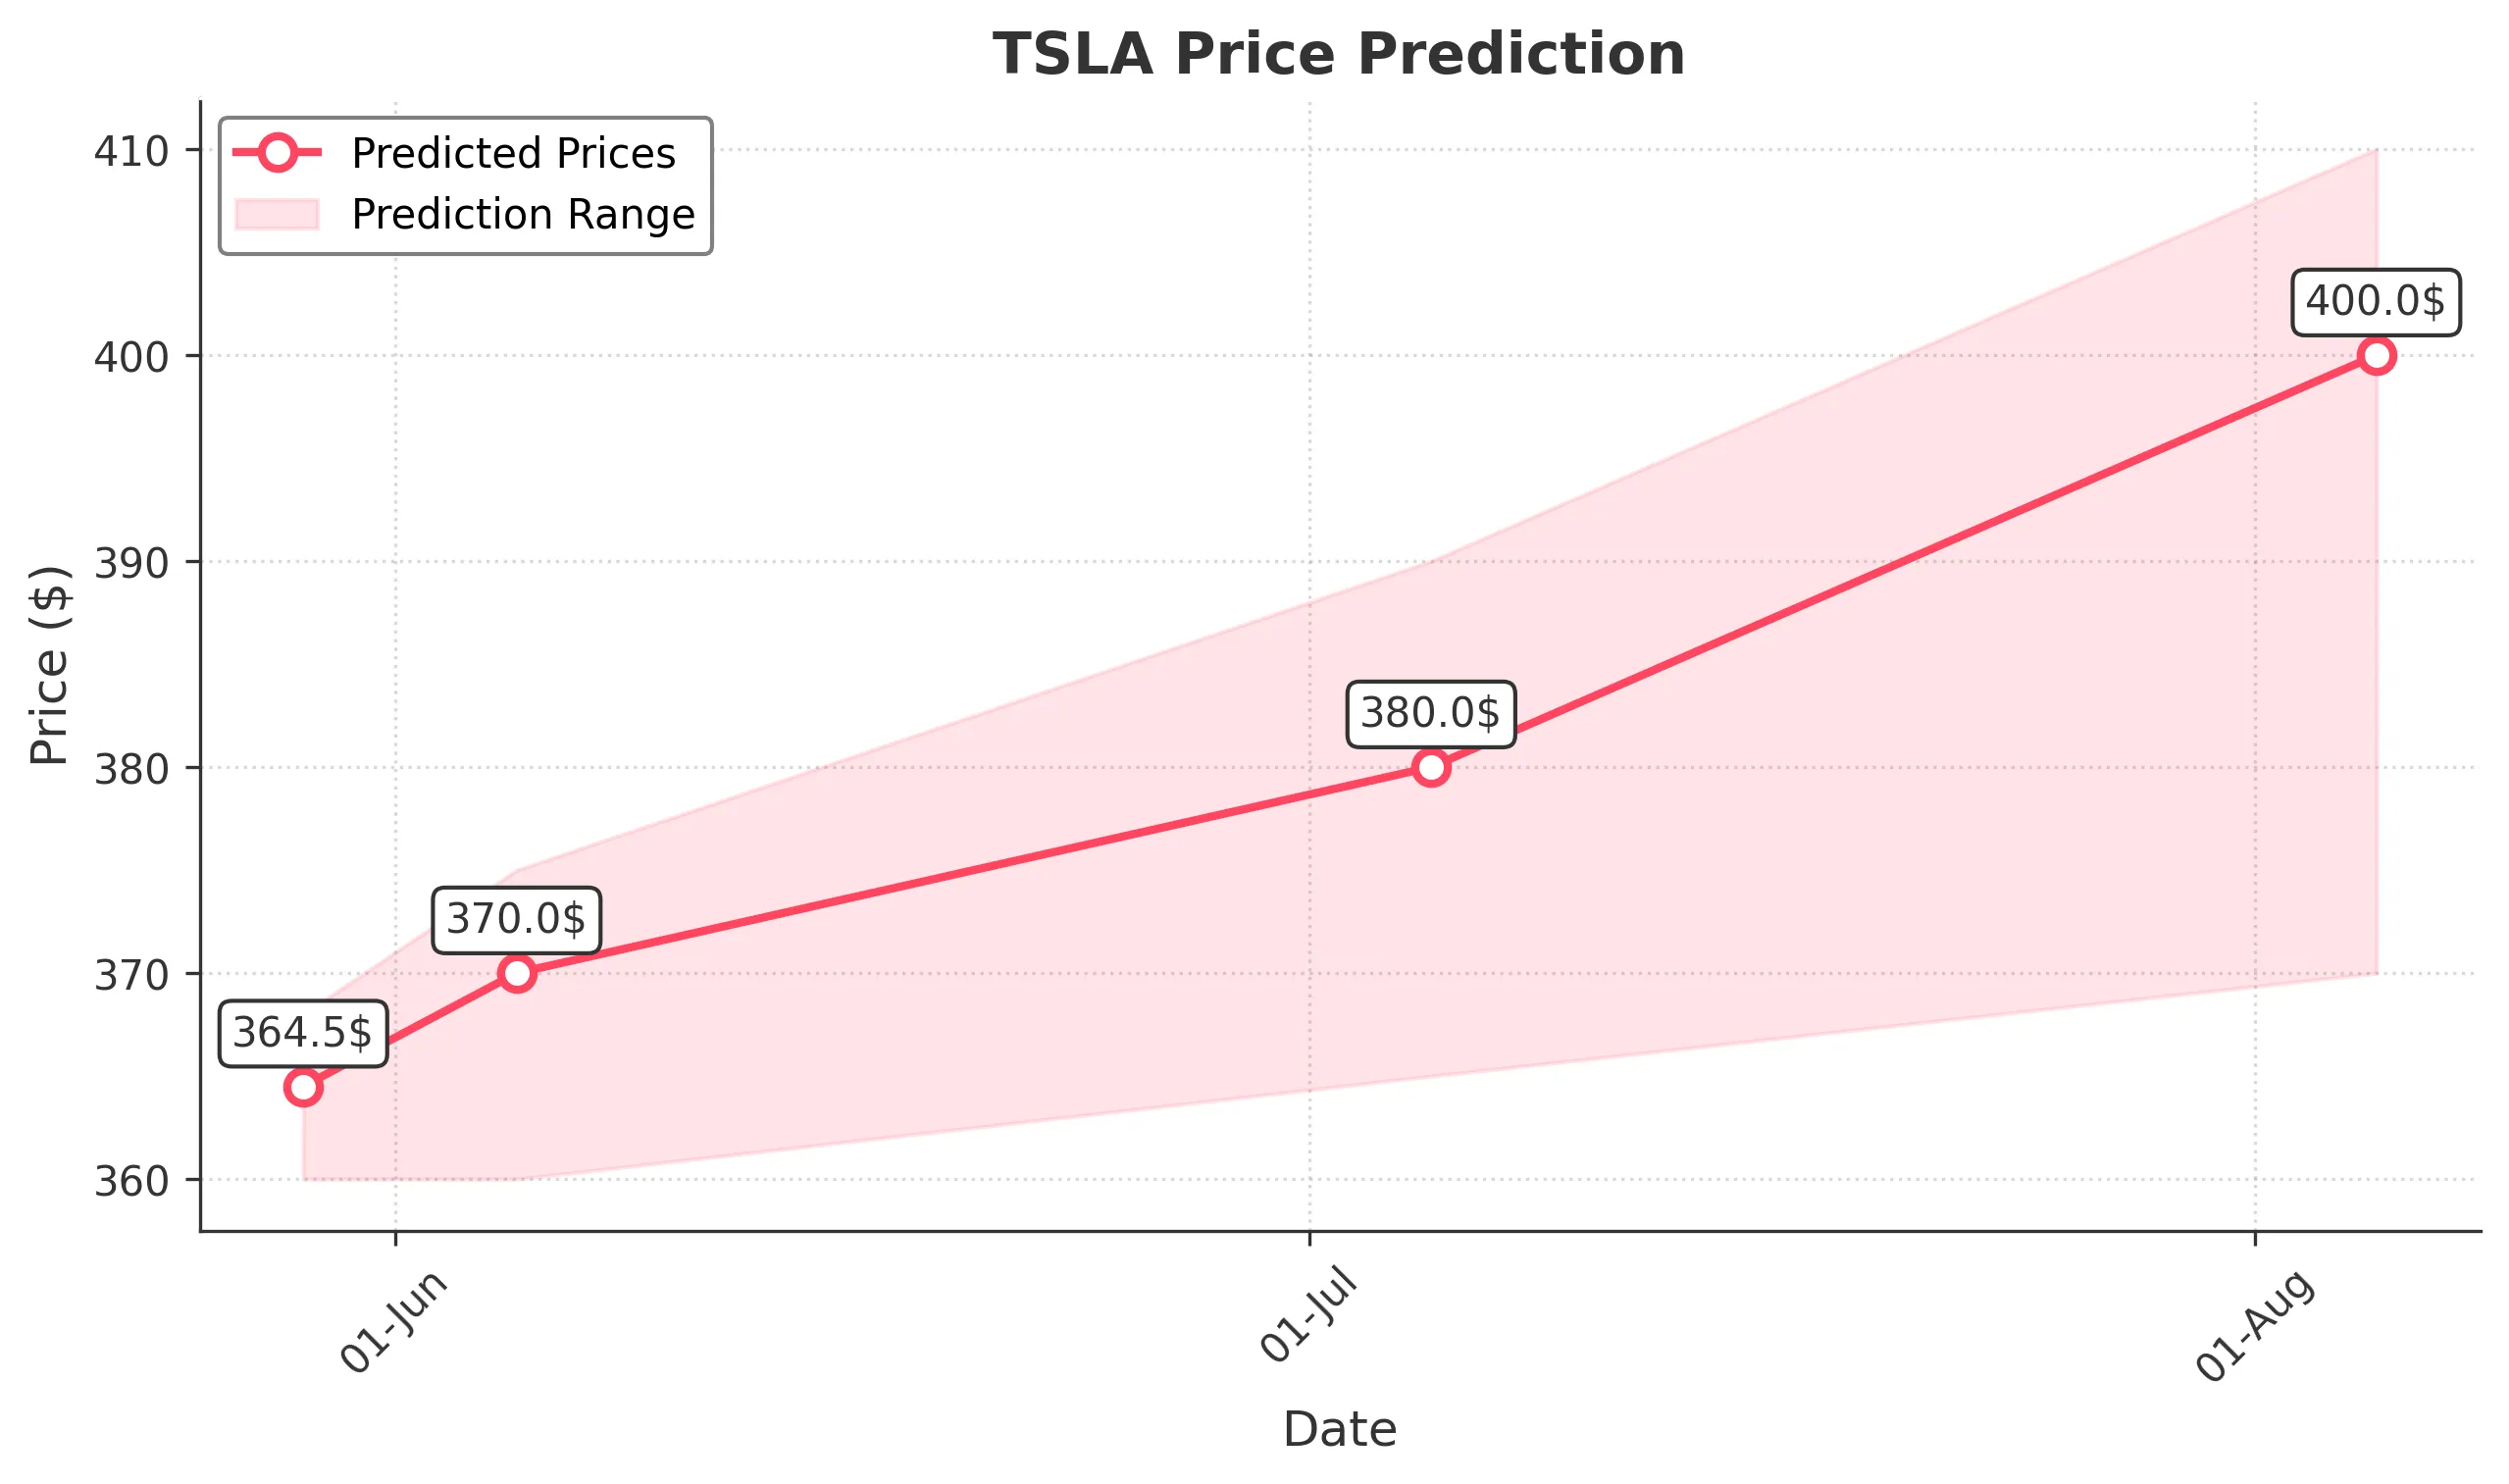
Target: May 29, 2025$364.5
$362
$368
$360
Description
The stock shows bullish momentum with a recent upward trend. The RSI is approaching overbought levels, indicating potential for a pullback. However, strong volume and positive market sentiment suggest a continuation of the upward trend in the short term.
Analysis
Over the past 3 months, TSLA has shown a bullish trend with significant price recovery from lows. Key resistance is around $365, while support is at $340. Volume spikes indicate strong buying interest. Technical indicators like MACD are bullish, but caution is advised due to potential overextension.
Confidence Level
Potential Risks
Potential for a pullback due to overbought RSI and market volatility.
1 Week Prediction
Target: June 5, 2025$370
$365
$375
$360
Description
The upward trend is expected to continue, supported by strong buying volume and positive market sentiment. However, the RSI indicates overbought conditions, which may lead to short-term corrections. Watch for potential resistance at $375.
Analysis
TSLA has been on a bullish trajectory, recovering from previous lows. The MACD is bullish, and volume patterns suggest strong interest. Key resistance at $375 may pose challenges, while support remains at $340. Overall, the sentiment is positive, but caution is warranted.
Confidence Level
Potential Risks
Market corrections could occur if profit-taking happens, especially with high RSI levels.
1 Month Prediction
Target: July 5, 2025$380
$370
$390
$365
Description
Expect continued bullish momentum as TSLA capitalizes on strong market sentiment and positive earnings reports. However, the RSI suggests potential overbought conditions, which could lead to volatility. Watch for resistance at $390.
Analysis
The stock has shown resilience with a bullish trend. Key support is at $340, while resistance is at $390. Technical indicators are generally positive, but the market's reaction to earnings and external events could create volatility. A balanced view is necessary.
Confidence Level
Potential Risks
Earnings reports and macroeconomic factors could introduce volatility, impacting the price.
3 Months Prediction
Target: August 5, 2025$400
$385
$410
$370
Description
Long-term bullish outlook as TSLA continues to innovate and expand. However, potential market corrections and economic factors could impact growth. Watch for resistance at $410 and support at $370.
Analysis
TSLA's performance has been strong, with a bullish trend supported by innovation and market sentiment. Key resistance at $410 may challenge upward movement, while support at $370 is crucial. The overall outlook is positive, but external factors could introduce risks.
Confidence Level
Potential Risks
Market volatility and economic conditions could lead to unexpected price movements.